Advanced Traders Daily: Reading Breadth, RS, Rotation
An advanced daily trading pillar that unifies breadth, relative strength, and rotation into one decision system—build a signal hierarchy, read participation and dispersion, diagnose RS structure and breakdowns, and apply confluence playbooks with execution and risk controls.
If you’re trading well but your read keeps flipping—risk-on today, risk-off tomorrow—you don’t have an edge problem. You have a signal integration problem.
This pillar shows you how to combine breadth, relative strength, and sector rotation into a single daily framework. You’ll learn what to trust first, how to spot narrow leadership before it breaks, when rotation is real versus a fakeout, and how to translate those reads into position sizing, stops, and hedges that match the tape.
Unifying Market Signals
Breadth, relative strength, and sector rotation are one loop, not three separate “indicators.” Breadth sets your risk dial, RS picks your battlefield, and rotation tells you when the crowd is actually moving.
Signal hierarchy
Regimes change what deserves your attention first, because not all signals speak at the same volume.
In practice, use this hierarchy:
- Breadth leads for risk: add or cut exposure when participation expands or collapses.
- RS leads for selection: buy the names winning while the tape is messy.
- Rotation leads for timing: press when leaders get fresh inflows again.
When you invert the order, you trade the prettiest chart in the wrong market.
Timeframe alignment
Different horizons tolerate different levels of disagreement, because speed changes what “confirmation” even means.
| Horizon | Breadth must be | RS must be | Rotation must be |
|---|---|---|---|
| Intraday | stable, not collapsing | clean on 5–30m | visible, real-time |
| Swing | improving or strong | persistent vs index | turning, not drifting |
| Position | broad, durable | multi-week leader | sustained, not whipsaw |
If your horizon is longer than your signal agreement, you are trading noise with conviction.
Failure modes
Most signal errors are sequencing errors, not math errors.
- Chasing breadth spikes after the move is spent
- Buying RS leaders as they enter late-cycle lag
- Reading sector churn as meaningful rotation
- Overfitting one indicator to every regime
Fix the order first. The read usually fixes itself.
Daily workflow
A repeatable scan beats a brilliant one-off call, because you need the same questions every day.
- Check breadth for risk-on or risk-off posture.
- Rank RS to find the clean leadership list.
- Identify rotation inflections into or out of those leaders.
- Build the trade with levels, size, and invalidation.
- Review outcomes and tag the signal that lied.
Your edge is the loop. Run it daily, then tighten it.
Breadth Under the Hood
A/D lines are the headline, but the edge is in what they hide. You’re tracking participation, dispersion, and where fragility sits by cap tier.
Participation vs thrust
Participation improves slowly when more stocks join the move over many sessions. Thrust shows up as a sudden, broad surge that forces price higher fast.
Slow participation is usually measured by rising percent-above-50DMA or steady up/down volume expansion. Thrust days look like “90% up volume” or extreme advances that arrive with urgency.
Treat thrust as fuel, not proof; follow-through odds improve only if participation keeps climbing after the spike.
Cap-tier splits
Cap-tier breadth tells you where liquidity is comfortable, and where it’s hiding. Watch large, mid, and small caps as separate risk regimes.
- Large strong, small weak: defensive risk-on, liquidity seeks safety
- Small strong, large flat: true risk-on, beta is being bid
- Mid leads, small lags: selective risk-on, managers stay “benchmark-adjacent”
- All three weaken together: broad risk-off, de-grossing is underway
- Small improves first: early rotation, but fragile if credit tight
When small caps refuse to confirm, your breakout is often a trade, not a trend.
Internal dispersion
Dispersion is what breadth looks like when the market stops moving together. It shows up when indexes grind higher, but internals fracture.
Track new highs vs new lows and percent-above-20/50/200DMA as a stack, not a single line. If new highs shrink while price rises, leadership is narrowing; if new lows expand under the surface, sellers are rotating into weaker groups.
When 200DMA breadth rolls over first, you’re seeing late-cycle fragility before price admits it.
Breadth edge cases
Some sessions lie to you, even when the tape looks clean. Know the distortions before you trade the signal.
- Rebalancing day: forced flows, breadth becomes mechanical
- Index inclusion: one-name demand skews advances and volume
- Mega-cap skew: cap-weight hides weak equal-weight internals
- Expiration effects: dealer hedging creates fake thrust
- Sector event shock: one group drags breadth, not “the market”
On these days, trust equal-weight and cap-tier splits more than any single breadth print.
Relative Strength Done Right
Relative strength (RS) is a selection filter, not a trophy. You’re trying to find durable leadership, not yesterday’s biggest bounce.
RS vs beta
High beta can look like “great RS” during a broad risk-on surge. That’s not leadership, that’s leverage to the tape.
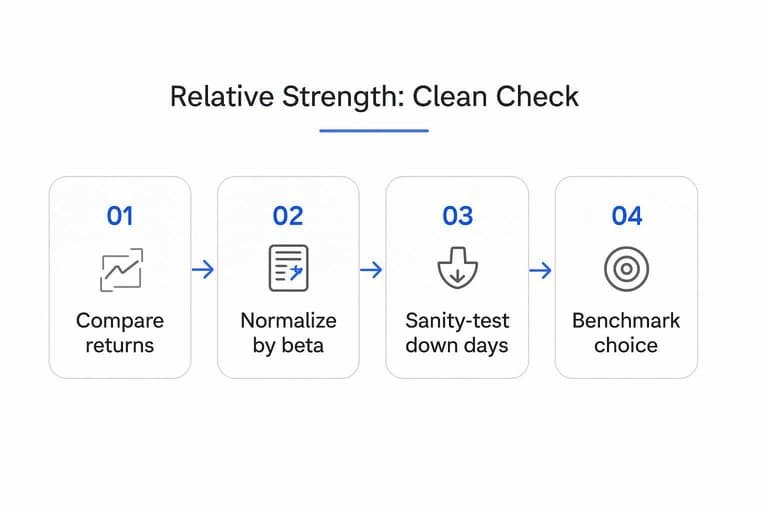
A clean check:
- Compare returns over the same window.
- Normalize by beta: excess = stock return − (beta × benchmark return).
- Sanity-test on down days: leaders lose less.
If “RS” vanishes after beta-adjusting, you never had leadership.
Benchmark choice
Your benchmark is your definition of leadership. Change the yardstick and you change the verdict.
- SPX: broad market leadership, macro-driven tape
- NDX: growth-risk leadership, duration-sensitive regimes
- Sector ETF: true within-group winners, factor matched
- Equal-weight index: breadth-driven, reduces mega-cap distortion
If the stock only “leads” versus the wrong benchmark, your thesis is already fragile.
RS structure
RS is most useful when it has a shape, not just a number. You want RS that holds up while price stops being noisy.
Look for three constructive looks:
- Rising RS while price tightens into a range.
- RS basing during a market pullback, not collapsing.
- RS breaking out before price breaks out.
When RS improves without price drama, institutions are usually building positions.
RS breakdowns
You want to catch leadership decay before price finally cracks. RS usually rolls first.
- Mark RS lower highs versus the benchmark.
- Watch for a failed RS retest at the prior peak.
- Confirm with expanding volatility on down moves.
- Check volume: heavy on red, light on green.
- Re-rank it weekly; don’t argue with drift.
If RS breaks structure, treat it like a thesis break, not “noise.”
Rotation as a System
Rotation is capital flow with constraints, not a mood swing. Your job is to separate true leadership change from temporary crowding.
Rotation regimes
Rotation comes in regimes, and each one changes your risk budget. You size and hold differently in a “banks lead” tape than a “utilities hide” tape.
Cyclical regime: growth and value both bid, leaders trend, hold longer and size up. Defensive regime: low beta and staples lead, leaders mean-revert, hold shorter and size down. Neutral regime: leadership churns, pairs work better, keep gross modest and take profits faster.
The edge is matching timeframe to regime, not forcing conviction in chop.
Relative rotation map
Use quadrant logic to turn relative strength into decisions, not vibes.
| Quadrant | RS trend | Action bias | Common trap |
|---|---|---|---|
| Leading | RS rising | Add on pullbacks | Late-cycle chase |
| Weakening | RS rolling | Trim, tighten stops | “It’s just a dip” |
| Lagging | RS falling | Avoid or short bounces | Bottom-fishing early |
| Improving | RS turning up | Starter size, scale | False breakout on news |
Quadrants are a process tool, so treat them like signals with position limits.
Crowding signals
Crowding makes rotation look clean right before it breaks. You want to spot the fragility early.
- Correlations snap tighter across “leaders”
- Volatility compresses while price grinds
- One factor explains most returns
- Reversals trigger on small headlines
When three show up together, you’re trading a crowded boat, not leadership.
Rotation catalysts
Catalysts push rotation through the market with lag and feedback. A hot CPI print can hit rates first, then financials, then high duration, then the index.
Macro prints move the front end, then reprice discount rates, then force sector reallocations. Earnings clusters concentrate information, so winners pull peers, then guide the whole group. Rates impulses create second-order effects, like energy to transports, then into margins, then into defensives.
Track the second move, not the headline, because that’s where positioning gets trapped.
Confluence Playbooks
Confluence is your cheat code when signals disagree and your brain wants a story. You trade the repeatable pattern instead, like “breadth leads, RS confirms, rotation pays.”
Risk-on alignment
You want the cleanest tape: a breadth thrust, leaders making new RS highs, and rotation expanding beyond one group.
- Enter on the first pullback to the breakout level, not the breakout candle.
- Add on a higher low with RS still rising versus the index.
- Trail stops under the 10–20 day pivot, tightening after a second add.
- Exit on breadth deterioration plus RS rollover, even if price looks fine.
Your edge here is speed plus participation, so press early and stop arguing with the exit.
Narrow leadership
Strong RS with weak breadth is a bull market with a limp. You can still get paid, but only in the names institutions can’t ignore.
Trade liquid leaders only, size smaller, and use tighter stops under obvious pivots. Take profits faster, like selling a first push into prior highs instead of “letting it ride.”
If breadth won’t join, your job is to rent strength, not marry it.
Rotation fakeouts
Rotation signals love to whipsaw around headlines and rebalancing weeks. You need a few hard filters before you treat “money is moving” as tradeable.
- Demand two closes of sector outperformance.
- Require relative volume above the 20-day average.
- Check breadth support inside the sector, not just the ETF.
- Confirm with intermarket risk, like credit tightening or easing.
If two filters fail, it’s usually not rotation, it’s noise with a chart.
Risk-off transitions
Breadth often breaks before price, and that’s your early warning siren. You act on that signal, or you donate open profit.
- Cut gross exposure by trimming laggards first, then weak leaders.
- Rotate into defensives with rising RS, not “cheap” cyclicals.
- Add hedges when breadth makes a lower low, not on the first dip.
- Re-risk only after breadth recaptures key levels and leaders regain RS highs.
Your goal is optionality: stay solvent in the slide, then be ready when the next thrust hits.
Execution and Risk Design
Your signals only matter if your sizing and hedges survive the next regime shift. Treat breadth, RS, and rotation as inputs to a risk system, not a prediction engine.
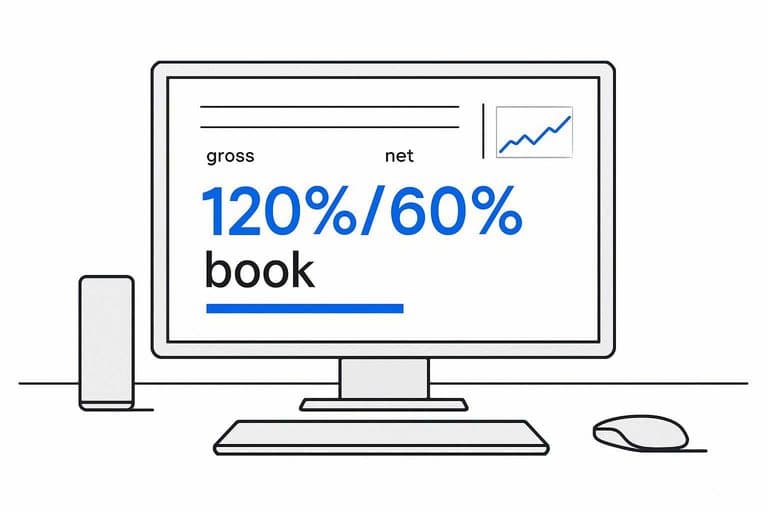
Gross vs net
Breadth is your exposure dial, because it measures participation, not just price direction. Use it to decide whether you run a hedged book or a smaller book when things get sloppy.
When breadth is strong, you can carry higher gross with modest hedges, because leadership is wide and trends persist. When breadth thins, keep gross selective but keep net controlled with explicit hedges, because single-name risk spikes.
A 120%/60% book and a 60%/0% book can share net, but they behave nothing alike.
Leader baskets
A leader basket keeps you exposed to what’s working, while limiting single-name noise. Build it from your RS ranks, not your opinions.
- Equal weight, unless liquidity forces caps
- Max 10–20% per name
- Cap pairwise correlation at your threshold
- Rebalance weekly, review daily
- Replace on RS break or earnings risk
If your “basket” moves like one stock, you bought concentration with extra steps.
Stops by structure
Stops should reflect structure, because volatility alone lies in rotations. Combine ATR, swings, and time so each trade has a clear failure mode.
- Set an initial stop at 1.5–2.5x ATR from entry.
- Anchor a hard stop beyond the last clean swing level.
- Trail with ATR bands once price makes a new impulse leg.
- Add a time stop when your signal decays by a set threshold.
- Tighten after failed breakouts or breadth divergences.
Time stops fix the silent killer: trades that stop moving, then steal your attention.
Hedge selection
Pick hedges based on what is breaking, not what feels safe. Breadth and rotation tell you whether risk is broad, sector-specific, or factor-driven.
Index puts work when breadth is deteriorating across the board, because correlation jumps and beta dominates. Sector hedges fit when rotation is violent but contained, like “financials roll while tech holds.” Factor hedges fit when leadership unwinds by style, like momentum cracking while defensives firm.
Hedge the leak you actually have, or you’ll pay premium to stay wet.
Signal Quality Controls
You will overtrade if every green light feels like certainty. Use diagnostics that force you to say “probable,” not “guaranteed.”
| Diagnostic | What to check | If it fails | What you do |
|---|---|---|---|
| Breadth alignment | Advancers confirm RS | Narrow leadership | Cut size, wait |
| RS regime fit | RS leads in trend | RS lags chop | Reduce frequency |
| Rotation speed | Groups change slowly | Fast sector churn | Shorten holds |
| Volatility filter | ATR matches plan | Volatility spike | Widen stops, size down |
| Liquidity + slippage | Fills near mid | Large slippage | Skip trade |
If two or more fail, you are trading a story, not a signal.
Tools and Templates
You need a repeatable capture sheet, not another chart dump. Use this checklist in your daily note, with numbers you can backtest.
- Log breadth: AD line, %>50DMA, new highs-lows
- Score RS: leaders vs benchmark, 1–5, with one sentence
- Mark rotation: risk-on groups up, defensives down, or mixed
- Note catalysts: earnings, CPI, FOMC, seasonality window
- Track outcome: next-day, 5-day, 20-day, with direction
If you can’t score it and track it, you’re writing vibes, not a process.
Build Your Daily Read, Then Trade the Best Expression
- Start with regime: align timeframes, set the signal hierarchy, and label the market as risk-on, mixed, or risk-off.
- Validate with breadth: confirm participation, cap-tier splits, and dispersion; flag edge cases like thrusts, exhaustion, or hidden deterioration.
- Rank opportunity with RS and rotation: identify leaders with clean RS structure, map rotation regimes, and avoid crowded “late” moves without catalysts.
- Execute with intent: choose the simplest expression (leader basket, pair, or hedge), place stops by structure, and manage gross/net so losses stay small when signals fail.
Frequently Asked Questions
What should a “traders daily” routine include if I only have 15 minutes each morning?
Use a fixed checklist: index trend/regime, key breadth snapshots, top/bottom relative strength lists, sector/industry leaders, and a one-line risk plan (max exposure, stops, hedge trigger). Most traders get more consistency from doing the same 5–7 checks daily than adding new indicators.
Is a traders daily note useful for swing trading and investing, or only for day trading?
It’s useful for both because the process is about decision quality, not timeframe. Swing traders often update the note daily but execute weekly, while investors use it to manage exposure and avoid adding risk during deteriorating conditions.
How do I measure whether my traders daily process is actually improving results?
Track outcomes with a simple journal: win rate, average win/loss, max drawdown, and expectancy by setup plus a “process score” (did you follow the checklist). Review every 20–30 trades or monthly to see whether adherence correlates with better returns and smaller drawdowns.
What tools are best for building a repeatable traders daily dashboard in 2026?
Most traders use TradingView for charts/alerts, Koyfin or Finviz for sector/industry scans, and a spreadsheet or Notion for scoring and journaling. The best stack is the one that lets you update in under 10 minutes and exports data for review.
How often should I update a traders daily watchlist and when should I remove names?
Refresh the core list weekly and do a quick daily check for broken setups, earnings dates, and liquidity changes. Remove names after a clear technical breakdown, loss of leadership for 2–4 weeks, or if they no longer fit your liquidity/volatility rules.
Turn Signals Into Watchlists
Breadth, relative strength, and rotation only work when you can track them daily and translate confluence into actionable candidates without guesswork.
Open Swing Trading brings daily RS rankings, breadth snapshots, and sector/theme rotation context into a fast 5–15 minute workflow—get 7-day free access with no credit card.