Alpha vs Beta: The Definitive Guide for Modern Swing Traders
Explore the critical differences in alpha vs beta. This guide shows swing traders how to use these metrics for smarter stock selection and risk management.
The core difference between alpha and beta really boils down to this: Alpha measures a stock's performance that is completely separate from the market's movement, while beta measures a stock's volatility in relation to the market.
For a discretionary swing trader, you can think of it like this: alpha is the profit you're actively hunting for—the direct result of your skill and analysis. Beta, on the other hand, is the inherent market risk you have to navigate and manage every single day.
Understanding Alpha and Beta in Swing Trading

In swing trading, your entire game is built around finding stocks poised for significant moves over a few days or weeks. This is exactly why a solid grasp of alpha and beta is so critical. These two metrics give you a powerful lens for judging potential trades and, just as importantly, your own performance over time.
Think about the S&P 500 as the baseline—the tide that lifts all boats. Beta simply tells you how much a specific stock tends to move with that tide. A high-beta stock is like a speedboat; it’s thrilling when the market is climbing but gets tossed around violently when things get choppy.
Alpha is something else entirely. It's the extra return you squeeze out on top of what the stock’s beta would suggest. It’s the direct result of your unique strategy—your knack for picking the right stocks, your timing on entries and exits, or your disciplined risk management. For those of us focused on open swing trading, generating alpha is the entire point.
For a swing trader, alpha isn't just a number; it's the direct measure of your edge. It quantifies your ability to find market leaders that deliver returns beyond what the broad market offers, turning your strategic analysis into tangible profit.
This distinction is crucial because it separates gains you get just by being in a rising market from returns that come from genuine skill. Anyone can ride a bull market up. Consistently generating alpha, however, proves you have a repeatable process that actually works.
To put it all in perspective, here’s a quick-glance table breaking down the core differences.
Alpha vs Beta At a Glance
| Metric | What It Measures | Ideal Trait for Swing Traders | Primary Use in Your Strategy |
|---|---|---|---|
| Alpha | A stock's risk-adjusted outperformance compared to a benchmark (e.g., S&P 500). | Positive and High: Shows the stock is a true market leader, generating its own momentum. | Screening for high-potential setups and measuring how effective my strategy really is. |
| Beta | A stock's volatility relative to the market. | Situational: I might prefer a higher beta in a strong bull market for more punch, but a lower beta in a choppy market to reduce volatility. | Managing position risk and dialing my aggression up or down based on current market conditions. |
This table helps frame the conversation. Alpha is about selection and skill, while beta is about risk and volatility. A successful swing trader needs to master both sides of that equation.
How to Interpret Alpha as Your Trader's Edge

The math behind alpha might look intimidating, but what it represents is actually quite simple and incredibly powerful. A positive alpha means a stock did better than expected, given its level of market risk (beta). In other words, it’s a direct measure of outperformance.
For a discretionary trader, finding alpha is the entire point of the game. It’s proof that your stock selection, timing, and management are adding real value—that you're doing more than just getting lucky with the market's overall trend. This outperformance is often fueled by a stock's strong relative strength, which is a key trait we look for when hunting for market leaders.
Consistently finding stocks that generate positive alpha is how you validate your trading strategy. It’s what separates genuine skill from random chance, proving your process can identify winners no matter which way the market is leaning.
What Alpha Looks Like in a Real Trade
Let's put this into a practical example. Imagine the S&P 500 has climbed 5% over the last quarter. You’ve been tracking stock XYZ, which has a beta of 1.2. Based on its beta alone, the market would expect XYZ to return about 6% (which is 1.2 times the market's 5% gain).
But your analysis picked up on strong fundamentals and a hot sector, and XYZ actually rallies 10%. The difference between what it did (10%) and what it was expected to do (6%) is your alpha.
Your Alpha Calculation:
Actual Return: 10% Expected Return (based on beta): 6% Alpha: 4%
That 4% is pure alpha. It's the extra return you captured because of the stock's own unique strength—strength that your trading process helped you spot. This is exactly what platforms like OpenSwingTrading are built for: to systematically screen for and rank stocks based on this kind of demonstrated outperformance.
Why You Have to Actively Hunt for Alpha
Alpha doesn't just fall into your lap. Generating it requires a disciplined, active approach to picking stocks, and it’s become even more crucial as market conditions change.
For instance, a detailed study covering 25 years of data revealed that while hedge funds once generated significant alpha, that edge has shrunk considerably in different market environments. The takeaway is clear: alpha is never a guarantee. It has to be actively hunted down. You can dig into the findings on hedge fund performance for more detail.
This gets to the heart of the alpha vs. beta debate. Anyone can get beta exposure by buying an index fund. But alpha is the direct reward for all your hard work—your research, your timing, and your risk management. It’s the tangible result of a well-honed process that separates the true market leaders from the crowd. Your ability to capture it, time and again, is what will ultimately define your success.
Using Beta to Master Market Risk
If alpha is all about your stock-picking skill, then beta is your go-to tool for managing the risk that comes with just being in the market. For any swing trader in 2026, getting a handle on beta isn't just a defensive move—it's a core part of an aggressive, opportunity-driven strategy.
Think of beta as a measure of a stock’s volatility compared to a benchmark like the S&P 500. A stock with a beta of 1.0 pretty much moves in sync with the market. Go above 1.0, and you're looking at higher volatility; dip below 1.0, and you've got a stock that's generally more stable. This isn't some abstract number; it's a lever you can actively pull to match your portfolio to what the market is doing right now.
Let's say market breadth is looking strong and the major indexes are pushing higher. This is the time to deliberately hunt for stocks with higher betas, perhaps 1.5 or greater, to really magnify your potential gains. This is a core part of the open swing trading philosophy—using the market's own momentum to your advantage with stocks built to run harder and generate superior returns.
Choosing the Right Beta for the Market Climate
On the flip side, when the market starts showing weakness or just chops sideways, a smart trader knows to shift gears. Instead of chasing high-beta names, your focus should pivot to capital preservation. This is when you start screening for stocks with a beta below 1.0. These stocks are less likely to get pulled down by a market-wide selloff, giving you a more defensive position while you wait for clearer skies.
This is where beta becomes incredibly practical. It plugs directly into a disciplined trading workflow where the very first thing you do is gauge the market's overall health. Tools like those at OpenSwingTrading give you the market breadth and trend data to make that call. Once you know if you're in a "risk-on" or "risk-off" environment, you can filter for stocks with the right beta profile for the job.
Beta isn't static; its importance fluctuates with the broader economic environment. Your ability to adapt your beta exposure based on real-time market conditions is a key differentiator between amateur and professional trading.
It’s also important to remember that a stock's market sensitivity can change. Historical data shows that a stock's performance, after accounting for beta, often correlates with short-term interest rates. This means a stock's beta might become more or less impactful depending on what the Fed is doing or where the economy is headed.
This reinforces the need for constant risk assessment. As you can learn from analysis on how interest rates influence hedge fund returns, these same macroeconomic forces apply to your own trading. When you truly master beta, you stop just reacting to the market and start strategically positioning yourself within it.
Putting Alpha and Beta to Work in Your Trading
Knowing the theory is one thing, but actually using it to make better trades is what really matters. For a discretionary swing trader, building a repeatable process around alpha and beta is the key to staying consistent. This isn't about overcomplicating things; it's about a simple, three-step process to sharpen your decisions, from reading the market to pulling the trigger on a trade.
This approach helps you sync up your strategy with what the market is actually doing, find the best stocks to trade, and manage your risk like a pro. The idea is to make every decision part of a structured, logical workflow.
Step 1: Get a Read on the Market Environment
Before you even think about looking at individual stocks, your first job is to gauge the market's overall health. Are we in a clear "risk-on" mode where traders are buying aggressively? Or is it a "risk-off" period where everyone is running for cover? Market breadth indicators are your best friend here.
When the indicators show widespread buying and underlying strength, that’s your green light. It’s time to hunt for higher-beta stocks—think 1.3 or greater—to ride the upward momentum. But if breadth is weak and participation is thinning, it’s smart to take a "risk-off" posture. In that scenario, lower-beta stocks are the safer, more defensive play.
Step 2: Screen for Stocks with High Alpha
Once you know what kind of market you're dealing with, the next move is to find stocks that are outperforming everything else. This is the hunt for alpha. While alpha is technically a backward-looking metric, you can use high relative strength (RS) as a fantastic real-time proxy to spot potential alpha-generators.
Stocks hitting new highs on the RS line are already showing leadership and have momentum that's independent of the broader market. This is a core idea behind the OpenSwingTrading approach—we focus exclusively on the strongest names.
A stock showing high relative strength while the overall market is struggling is basically shouting that it has positive alpha. It's a true market leader, driven by its own powerful story, making it an absolute top-tier candidate for your watchlist.
Using a platform that ranks stocks by performance, like OpenSwingTrading, makes this a whole lot easier. Instead of getting lost trying to sift through thousands of charts, you get a daily, curated list of the market's top performers. This lets you focus your energy on analyzing the handful of stocks that actually fit the market conditions you identified in step one.
Step 3: Dial In Your Position and Portfolio Risk
Finally, you bring beta directly into your position sizing and risk management rules. Your trading plan needs to be flexible, adapting to both a stock's individual volatility and the market's current stability.
Here’s a simple framework for how this works in practice:
- Strong Market, High-Beta Stock: This is the ideal scenario. You can confidently take a full-size position in a stock with a beta of 1.5, aiming to capture those bigger, amplified gains.
- Choppy Market, High-Beta Stock: The market is shaky, but you've found a strong leader. You still take the trade, but you might cut your position size by 30-50% to protect yourself from the heightened market chop.
- Weak Market, Low-Beta Stock: You’re mostly on defense, but a solid setup appears in a low-beta name. You might take a small "pilot" position, since your main goal is protecting capital, not hitting home runs.
This three-step workflow—Assess, Screen, Manage—transforms alpha and beta from abstract ideas into practical trading tools. It gives you a repeatable structure for every single trade, making sure you’re always adjusting your aggression and stock selection to the reality of the market.
Alpha vs. Beta in Different Market Scenarios
Knowing the textbook definitions of alpha and beta is one thing. Actually knowing which one to lean on in the heat of the moment—that's what separates consistently profitable swing traders from the rest. Your strategy has to be fluid, shifting from hunting for high-alpha outliers to riding high-beta movers, depending on what the market is giving you. This is how these metrics go from academic theory to a real-world decision-making tool.
When the market is in a full-blown bull run, your job is to get on board and ride the wave. In these "risk-on" environments, you want to focus on stocks with a higher beta—think anything above 1.3. These names are built to move faster than the market, giving you more juice for every point the S&P 500 climbs. Alpha is always great, but leveraging market momentum with beta is the most direct path to outsized gains when everything is going up.
Navigating Choppy or Bearish Markets
But when the tide goes out, the game completely changes. In a choppy, sideways, or downright bearish market, chasing high-beta stocks is a fast way to blow up your account. Their inherent volatility will work against you, amplifying every downward move. This is when your focus has to shift entirely to finding high-alpha stocks.
A stock that can generate positive alpha when the market is weak is a rare beast. It's showing true relative strength, powered by something internal—a killer earnings report, a new product, or industry-wide disruption—that lets it fight against the market's bearish gravity. Finding these leaders is your key to survival, and even profitability, when most other stocks are getting crushed.
In a bull market, beta is your accelerator. In a bear or choppy market, alpha is your lifeline. A robust trading process helps you identify which one to lean on.
Making these tactical shifts requires a repeatable workflow. It's a top-down process: assess the overall market health first, then screen for stocks that fit the current environment, and finally, manage your risk with precision.
This decision tree shows a simple but powerful workflow that guides you from the big-picture market assessment all the way down to trade execution.
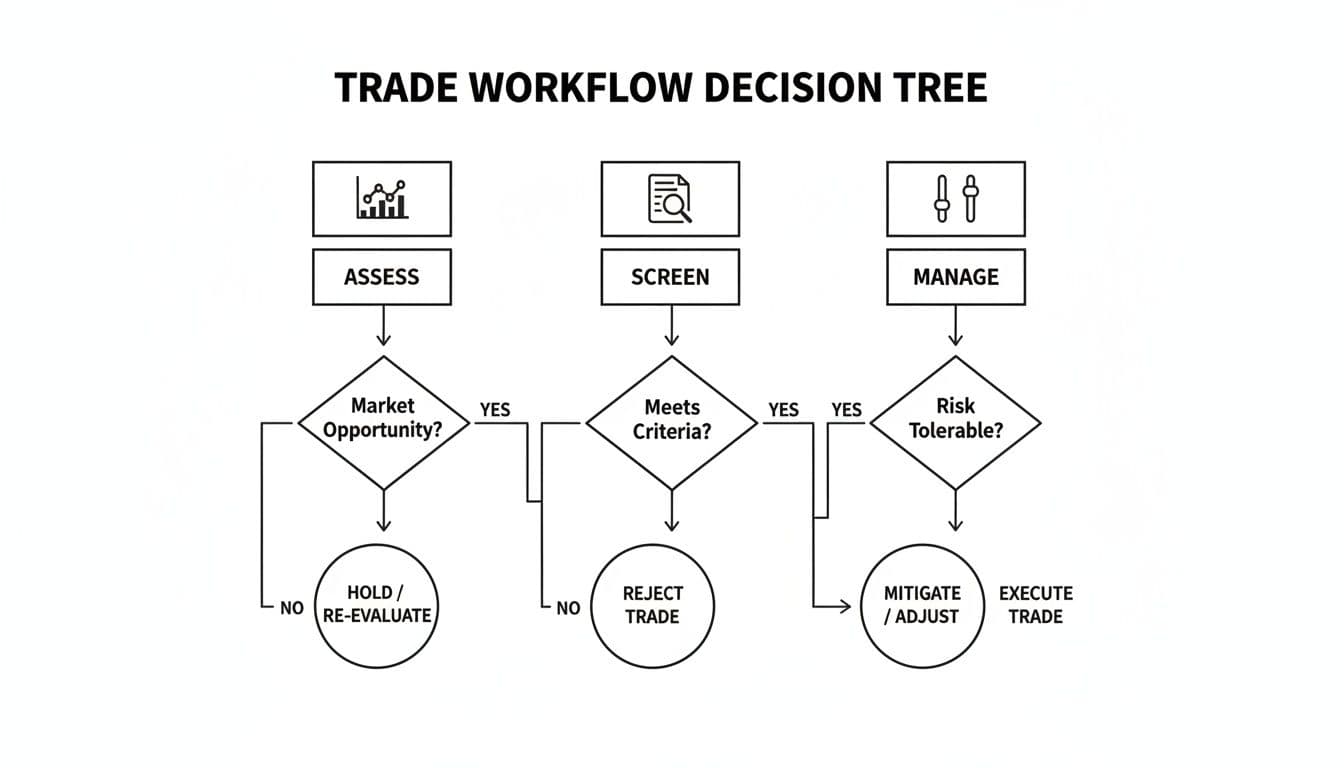
This kind of top-down analysis is crucial. It ensures your individual trades are always in sync with the broader market's direction, which is where the real edge is found.
The True Cost of Finding Alpha
The hunt for alpha is vital, especially when you factor in the real-world costs of active trading. A fascinating full analysis of hedge fund performance found something pretty sobering. Of 12.72% in pre-fee returns, alpha only accounted for 3.04%, while beta exposure delivered 5.94%. Even worse, the alpha that was generated was almost completely eaten up by 3.74% in fees.
For an individual swing trader, the lesson is clear: your outperformance (your alpha) has to be big enough to clear the hurdles of commissions, slippage, and other trading costs. This is why a systematic, data-driven approach is so important.
The table below offers a practical guide for adjusting your focus based on what the market is doing.
Strategic Focus Alpha vs Beta in Different Market Conditions
| Market Condition | Primary Metric Focus | Strategic Action for Swing Traders | How OpenSwingTrading Helps |
|---|---|---|---|
| Strong Bull Market | Beta | Screen for high-beta stocks (>1.3) to maximize gains from broad market momentum. Keep stops tight to manage volatility. | Our market breadth indicators confirm strong participation, while our screeners can filter for high-beta industry leaders. |
| Choppy / Sideways Market | Alpha | Focus exclusively on stocks showing strong relative strength and positive alpha. Avoid "me-too" stocks that just follow the index. | Our relative strength algorithm identifies stocks bucking the trend, helping you find leaders in a directionless market. |
| Bear Market | Alpha (and Cash) | Primarily hold cash. Only consider shorting high-beta stocks or buying rare stocks with extremely high alpha and sector strength. | By highlighting the few stocks outperforming a falling market, we help you find the rare long opportunities or top short candidates. |
| Sector Rotation | Both | Identify the leading sectors (alpha focus) and then find the high-beta names within those sectors to ride the rotation. | Our sector analysis tools pinpoint where institutional money is flowing, letting you get ahead of major rotations. |
This situational approach is key. It ensures you’re not trying to force a strategy that’s out of sync with market reality.
This is where platforms like OpenSwingTrading become invaluable. We use quantitative methods to screen for stocks with persistent relative strength—a key proxy for alpha. By systematically identifying these leaders, you dramatically improve your odds of finding trades where the potential alpha is significant enough to overcome costs and grow your account.
Common Questions About Alpha and Beta
Even when you have a solid trading plan, putting concepts like alpha and beta into practice can raise some questions. Getting clear on these points is what turns abstract theory into confident, real-world trading decisions. Let's tackle some of the most frequent questions swing traders have, with direct answers to help you use these metrics effectively.
The idea here is to get beyond the textbook definitions and into the nitty-gritty of analyzing trades in a real market, where a sharp understanding of both risk and performance is non-negotiable.
Can a Stock Have High Alpha and Low Beta?
Absolutely, and for many traders, this combination is the holy grail. A high-alpha stock is outperforming the market on its own terms, independent of the broad trend. When you pair that with a low beta, you get a stock that's also less volatile and not as likely to get dragged down by minor market jitters.
This is the classic profile of a true market leader in a powerful sector. It’s a company driven by such strong internal catalysts—maybe disruptive tech or explosive earnings growth—that it charts its own course. For a swing trader, finding these high-alpha, low-beta stocks, especially in a choppy market, is a top priority. They offer a shot at solid gains with less systemic risk.
The ideal trade in a volatile market is often a high-alpha, low-beta stock. It’s a leader that’s not just winning the race but is also running on a smoother track than everyone else.
How Often Should I Check a Stock's Beta?
Since beta is a historical metric calculated over a longer timeframe, it doesn't swing wildly from one day to the next. There's no need to obsessively re-check it for a position you plan to hold for a few days or weeks.
A sensible approach is to look up the stock's published beta from a reliable source when you're first screening it. This gives you a solid baseline for its typical volatility. Just remember that its short-term behavior can still deviate, especially around big news events or major market shifts. The key is to know its general character before you enter a trade so you can set your position size and risk parameters accordingly.
Is Alpha the Same as Relative Strength?
They're closely related, but they aren't the same thing. Alpha is a specific, backward-looking statistical formula that measures risk-adjusted outperformance against a benchmark. In contrast, Relative Strength (RS) is a more immediate, real-time comparison of a stock's price action against the market (like the S&P 500) or its industry peers.
In practice, a stock showing high RS is often one of the best real-time clues that it's probably generating positive alpha. Many swing traders use RS as a live proxy to screen for high-alpha candidates because it pinpoints stocks that are leading the market right now. For instance, a great way to systematically find stocks with strong alpha characteristics is to screen for those with the highest volatility-adjusted RS.
Ready to stop guessing and start using a data-driven process to find market leaders? OpenSwingTrading provides the tools you need to assess market health, identify high-alpha candidates through relative strength rankings, and make more informed trading decisions. Start your 7-day free trial and see the difference a systematic approach can make. Learn more at OpenSwingTrading.com.