
Auction Market Theory A Modern Guide for Swing Traders
Master Auction Market Theory to gain a trading edge. Learn how to read market profiles, spot value areas, and execute smarter swing trades with confidence.
Auction Market Theory forces us to see the market for what it truly is: a relentless, two-way auction. Forget the random ticker tape. This is about understanding the why behind price movement by decoding the constant battle between buyers and sellers as they search for fair value.
Unlocking Market Structure with Auction Theory
Think of the stock market as a massive, ongoing auction house, always hunting for the price levels that attract the most two-sided trade. That’s the simple, powerful idea behind Auction Market Theory (AMT). For a swing trader in 2026, this isn't just theory; it’s a practical map for reading the market's intentions and spotting high-probability setups.
AMT helps you look past superficial chart patterns to see the market’s underlying architecture. It clearly shows where buyers and sellers agree on value and, more importantly, where they disagree. Those points of disagreement are where explosive, directional moves are born. For anyone running an open swing trading style, this perspective provides an actionable edge, allowing you to anticipate major moves before they happen, leading to more profitable trades with better risk management.
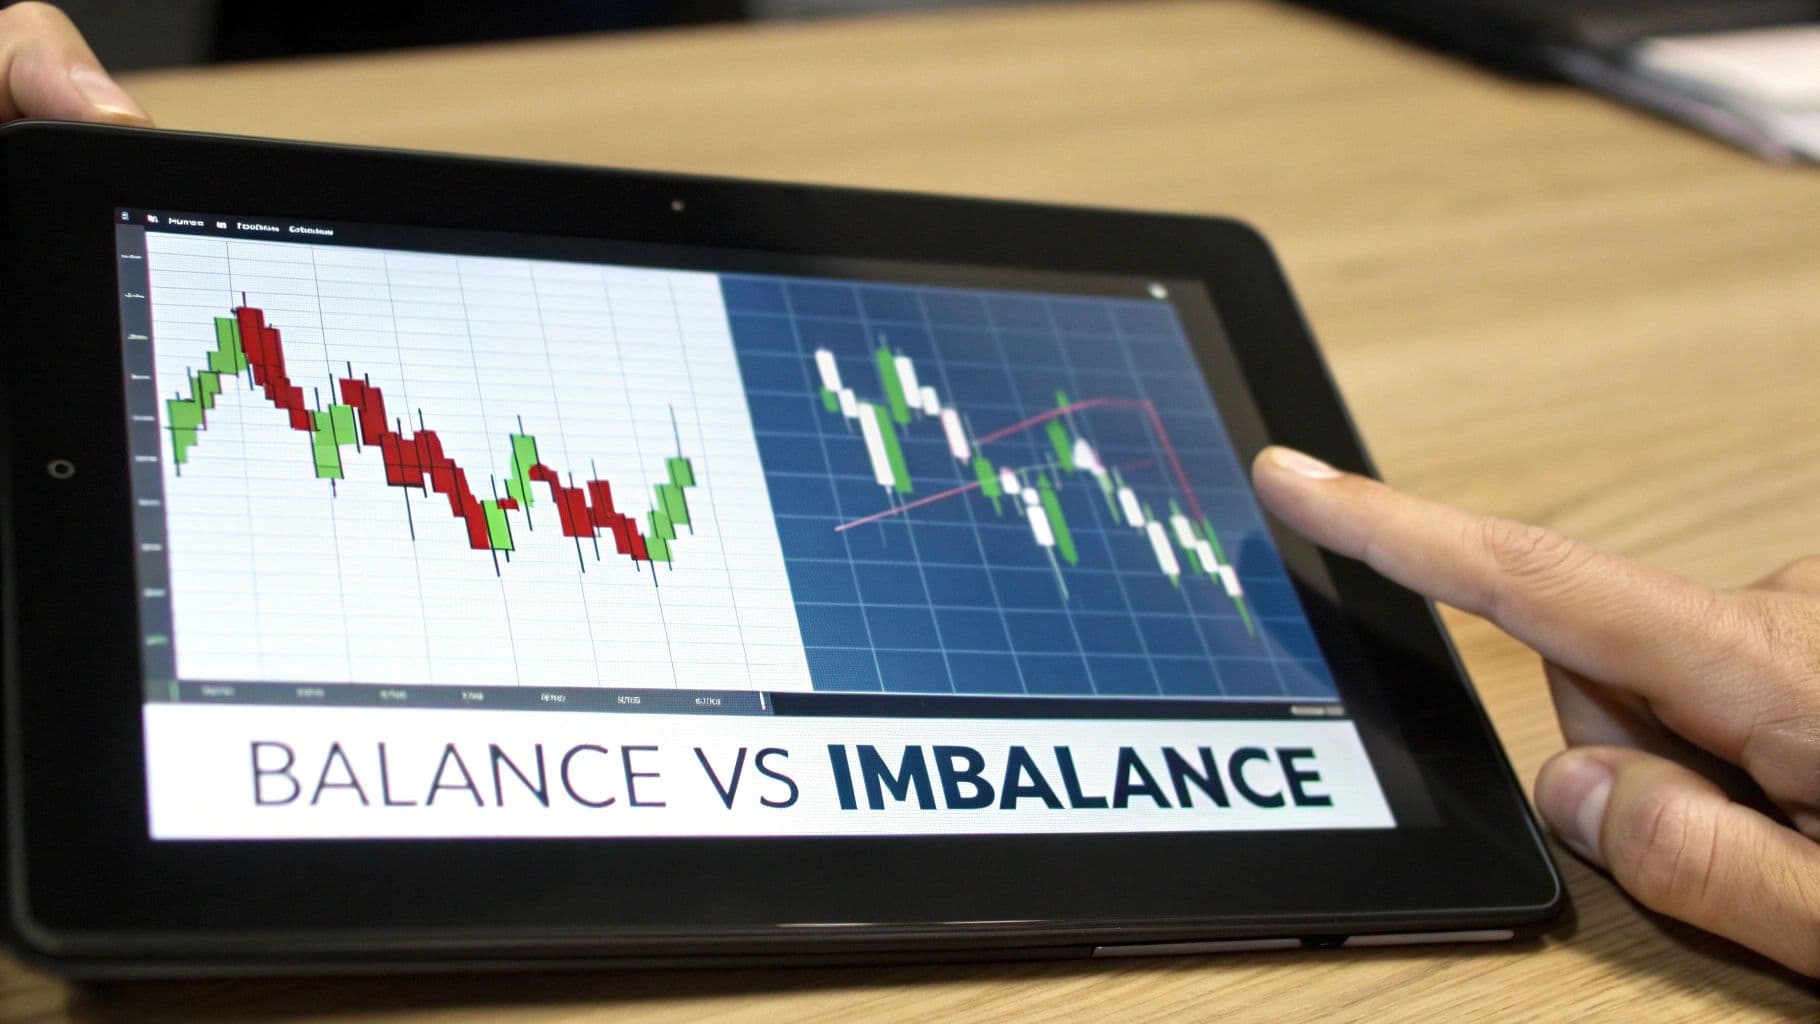
Balance vs. Imbalance: The Market's Two States
At its core, AMT teaches that a market can only be in one of two states: balance or imbalance. Grasping this simple duality is the key to anticipating what the market might do next, instead of just reacting to what it just did.
- Balance (Consolidation): Picture a price range where buyers and sellers are pretty much in agreement. The market auctions back and forth here, creating what most traders call a "chop zone" or consolidation. In this area, the price is seen as fair by both sides.
- Imbalance (Trending): This is what happens when that agreement shatters. Either buyers get aggressive and have to push prices higher to find willing sellers, or sellers take command and drive prices lower to entice buyers. This is the engine that drives clean, directional trends.
Here’s a powerful insight that should shape how you view the market in 2026:
A core statistical insight reveals that markets exhibit true trend movement only 9.5% of the time. They spend the vast majority—about 90.5%—in states of balance or consolidation.
This single statistic is a game-changer for swing traders. It tells us that our primary job isn't chasing moves, but patiently waiting for the auction to reveal its hand. A balanced, choppy market isn't a signal to force trades; it's a signal to get ready.
These long stretches of balance are the perfect time to build a killer watchlist. Using a platform like OpenSwingTrading to find stocks with high relative strength lets you prepare to act with conviction the moment the market breaks out of balance. This way, you’re not just trading any random breakout—you’re trading a breakout in a market leader as the wind shifts in your favor, which massively stacks the odds on your side. For a deeper dive into these dynamics, check out Jan Firich's analysis on ATAS.net.
To put it all together, let's break down how these core principles directly apply to making better swing trading decisions.
Core Principles of Auction Market Theory
| AMT Principle | What It Means | Actionable Swing Trading Application |
|---|---|---|
| Market as a Two-Way Auction | The market's primary job is to facilitate trade by moving up to find sellers and down to find buyers. | Don't fight the auction. Identify the direction of the current search and align your trades with it for better win rates. |
| Price Advertises Opportunity | Price moves to areas where it has not been recently to see if new business can be done there. | A breakout isn't just a pattern; it's the market advertising new, potentially unfair prices. Enter as this new consensus forms. |
| Markets Seek Value | The auction process builds a "value area" where the majority of trading occurs, representing perceived fair price. | Focus trades around the edges of value. A move away from value signals rejection and a potential, high-momentum trend. |
| Balance & Imbalance Cycles | Markets constantly move from periods of balance (range-bound) to imbalance (trending) and back again. | The best trends emerge from periods of balance. Use consolidations to plan your entry for a powerful breakout, maximizing your potential gains. |
Understanding these ideas isn't just about adding new jargon to your vocabulary. It’s about building a framework that helps you interpret market behavior in real-time, giving you the confidence to act when opportunity truly knocks.
The Building Blocks: Market and Volume Profiles
To really put Auction Market Theory to work, especially as we look towards 2026, you need a way to see the auction process as it happens. This is where Market and Volume Profiles come in. Think of them less like a chart and more like an X-ray of the market, revealing the skeleton of the auction by showing exactly where the most—and least—trading activity took place.
A standard price chart just gives you the open, high, low, and close. A profile chart, on the other hand, flips that perspective 90 degrees. It builds a histogram showing how much time or volume was spent at every single price level. This simple change is surprisingly powerful. It takes a flat, one-dimensional view of price and turns it into a three-dimensional map of where the market found conviction.
The diagram below really captures the essence of this auction flow, showing how markets move from imbalance to balance and back again.
This visual shows the constant search for equilibrium (balance) before the market breaks out to discover new prices (imbalance). For us swing traders, seeing this cycle clearly is the key to timing entries in stocks that are ready to make a move.
Decoding the Value Area and Point of Control
When you first look at a profile, two features will immediately jump out: the Value Area and the Point of Control. If you can master these two concepts, you'll have an instant read on where the market perceives "fair" price.
- Value Area (VA): This is the heart of the auction. It's the price range where roughly 70% of that session's trading volume occurred. Picture it as the busiest aisle in a supermarket—it's where most people are comfortable doing business. For a swing trader, the edges of this Value Area become incredibly useful dynamic support and resistance levels.
- Point of Control (POC): This is the one price level within the Value Area where the most volume was traded. It shows up as the longest bar on the histogram and represents the point of maximum agreement—the "fairest" price of the day. The POC acts like a powerful magnet for price.
One of the biggest edges this gives swing traders is watching how price behaves around the edges of a prior day's Value Area. When price breaks out and manages to hold outside of that zone, it's a huge signal. It tells you the market is rejecting the old "fair" price and is starting a new search—which is the very definition of a trend.
Understanding this structure adds much-needed context to price action. Instead of just seeing a random bounce, you can identify it as a rejection from yesterday's value area high. This brings a layer of objective analysis to your trades that is far more reliable than just drawing subjective trendlines on a chart.
High Volume vs. Low Volume Nodes
Beyond the main Value Area, the overall shape of the profile is defined by "nodes"—lumps and gaps that tell a story of where price was accepted or rejected.
High Volume Nodes (HVNs) These are the bulges in the profile. They represent areas where buyers and sellers came to an agreement and a ton of business was done. Think of these as zones of balance and high liquidity.
- Actionable Swing Trading Insight: HVNs are like concrete walls for price; they act as strong support or resistance. Price has a tendency to get stuck in these areas, making them poor places to enter a trade but excellent spots to set a price target or manage your risk.
Low Volume Nodes (LVNs) These are the thin, stretched-out parts of the profile. Very little trading happened here because one side of the market—either buyers or sellers—was extremely aggressive, pushing price through quickly.
- Actionable Swing Trading Insight: LVNs are price vacuums. Once price pushes into an LVN, it often shoots right through it, looking for the next area of acceptance (the next HVN). This is a massive advantage for swing traders, as a breakout through an LVN suggests there’s little resistance ahead for a strong, fast move, enabling larger profits.
By learning to read these simple building blocks, you can quickly size up the market's structure, pinpoint key support and resistance zones, and get a feel for where price is likely to speed up or grind to a halt. This gives you an objective framework that pairs perfectly with the macro signals you get from a platform like OpenSwingTrading, allowing you to find precise entry points in the market's strongest stocks.
Reading the Market: The Constant Tug-of-War Between Balance and Imbalance
This is where Auction Market Theory stops being theoretical and becomes a practical, edge-giving skill for swing traders in 2026. At any point in time, the market is doing one of two things: it's either accepting a price range or forcefully rejecting it. Learning to see this dynamic is the real secret to knowing when to sit on your hands and when to act with conviction.
Think of a market in balance as a tense negotiation where buyers and sellers have agreed to a temporary truce. They’ve found a price range they both consider fair, which creates the sideways, choppy price action most traders call consolidation. This is the market's natural state of rest.
A market in imbalance, on the other hand, is what happens when that truce shatters. One side completely overpowers the other, forcing price to trend aggressively up or down in search of a new area where a fresh negotiation can start. For a swing trader, these are the moments that create the biggest opportunities.
How to Identify Market Balance on Your Charts
Spotting a balanced market is pretty straightforward once you know the signs. It’s a state of acceptance, where the auction is happening inside a well-defined structure. Seeing this structure is your cue to prepare, not to jump into a trade.
Here’s what a balanced market typically looks like:
- Overlapping Value Areas: If you look at the market profiles for several days in a row, you’ll notice their Value Areas sit largely on top of each other. This is the market repeatedly saying, "Yes, this is a fair price."
- Symmetrical, Bell-Shaped Profiles: The profile itself often forms a classic bell curve—wide in the middle and thin at the edges. This visual tells you most of the trading happened around a central Point of Control (POC).
- Responsive Price Action: Price just seems to bounce back and forth within the range. Every time it tries to break out, an opposing force pushes it right back toward the middle. Traders often call this "mean reversion."
As a swing trader, your job during a period of balance isn't to force trades in the chop. It's to use the quiet time to your advantage. This is the perfect window to fire up your scans on a platform like OpenSwingTrading and build a watchlist of stocks showing exceptional relative strength.
While the broader market is going sideways, you can methodically find the leaders that are coiling up for a big move. When the market finally breaks out of balance, these are the stocks that will likely lead the way.
Spotting the Shift to Market Imbalance
The transition from balance to imbalance is the moment every swing trader lives for. It’s a clear sign of rejection—the market has decided the old price range is no longer fair and is now on an aggressive hunt for a new one. This is what fuels a powerful trend.
You can spot this shift by looking for these tell-tale signs:
- Price Breaks and Holds Outside of Value: The single most important signal is when price moves decisively outside the established balance area and starts to build value there. This isn't just a quick spike; it's a sustained move where price is being accepted at new levels.
- Elongated, Thin Profiles: A trending day often leaves behind a long, skinny profile. This shape shows that price traveled quickly from one level to another without much two-sided trading—a classic fingerprint of one side being in total control.
- Initiative Driving Price: Instead of the back-and-forth responsive action, you see clear initiative buying (price pushing higher) or initiative selling (price driving lower). The market isn't rotating anymore; it's exploring.
The core ideas of balance versus imbalance drive price discovery on every exchange in the world. This framework directly helps swing traders find better candidates using tools like OpenSwingTrading's sector analytics. Research shows that markets spend the vast majority of their time in balance, simply auctioning within a value area until a consensus shift sparks a period of imbalance. You can dive deeper into this dynamic by exploring insights from Bookmap.com on how markets move. Ultimately, this understanding helps you filter out the noise and focus only on the high-potential setups that are ready to run.
Actionable Swing Trading Setups Using AMT

Alright, now that we've got the core concepts of balance and imbalance down, let's get to the good stuff—translating Auction Market Theory into a concrete trading playbook for 2026. What follows are high-probability scenarios that show up time and again, offering clear entry, exit, and target points for swing traders.
The real magic happens when you line these setups up with broader market strength. That's where you get the powerful, synergistic moves.
This is exactly why integrating a platform like OpenSwingTrading gives you such a massive edge. Instead of randomly hunting for setups, you can first get a read on the market's overall health, pinpoint the strongest sectors, and then apply AMT principles to the stocks leading the charge. This top-down approach makes sure you're always trading with institutional momentum at your back.
Let's break down three classic setups I look for.
Setup 1: Trading the Value Area Breakout
This is the quintessential trend-following play in the AMT world. It all starts when price breaks out of a well-defined balance area and starts building value—or finding acceptance—at new, higher prices. This is a clear signal that the market's collective opinion of "fair value" has officially shifted.
Patience is your best friend here. A true breakout isn't just a quick spike; it’s a confirmed change in behavior. You want to see price close and hold outside the previous value area. That tells you market participants are now comfortable doing business at these new levels, which is the fuel for the next leg of the trend.
An actionable workflow for this setup looks like this:
- Find the Balance: Scan for a stock with multiple, overlapping value areas over several days or weeks. This creates a clear consolidation zone or "balance area."
- Wait for the Break: You need to see a decisive close outside the High Volume Node (HVN) that anchored that balance area. No ambiguity.
- Confirm Acceptance (Your Entry): The best entry often comes on a retest. Watch for price to pull back to the edge of the old value area, which should now act as support, and see if it holds.
- Set Your Target: The next significant High Volume Node above makes for a logical profit target. Alternatively, if the trend is strong, you can use a trailing stop to let the winner run.
Using this method turns a generic breakout into a trade with real context, drastically improving its reliability.
Setup 2: The Failed Auction Reversal
A failed auction is one of the most powerful reversal signals you can find, and it often marks a major turning point. This happens when the market makes an aggressive push in one direction, fails to attract any new business there, and then reverses violently as the other side seizes control.
You can spot this setup by looking for a "tail" on the market profile—that long, thin section with almost no volume. A long buying tail at the bottom of a range signals a failed auction to the downside. A long selling tail at the top signals a failed attempt to move higher.
For swing traders, spotting a failed auction at a key support or resistance level is a high-conviction signal. It’s the market shouting that prices at that extreme were overwhelmingly rejected, often leading to a multi-day reversal. This provides a clear, low-risk entry against the point of failure, maximizing the risk/reward of your trade.
This setup is especially potent for catching trend reversals in hot stocks that have gotten way ahead of themselves.
Setup 3: Using Low Volume Nodes as Price Magnets
Think of Low Volume Nodes (LVNs) as vacuums. Because so little trading happened in these zones, they represent areas of structural weakness with hardly any support or resistance. When price enters an LVN, it tends to shoot right through it until it hits the next area of high volume (an HVN).
This creates a fantastic opportunity for setting profit targets with a high degree of accuracy. For a swing trader, this is a double win: you can anticipate both the speed and the distance of a potential move.
Here’s an actionable strategy combining OpenSwingTrading and AMT:
- Step 1 (Macro View): First, use OpenSwingTrading to confirm the overall market is healthy and identify a top-performing sector.
- Step 2 (Candidate Selection): From that sector, filter for a stock showing high relative strength that is currently consolidating in a balance phase (our Setup 1).
- Step 3 (Trade Execution): Enter the trade as the stock breaks cleanly out of its value area.
- Step 4 (Profit Target): Now, look at the composite profile to find the next significant LVN above. You can place your primary profit target at the High Volume Node just beyond that LVN, since price is likely to accelerate through that weak zone before finding its next wall of resistance.
This process combines the big-picture context with precise, micro-level execution. It’s a complete, repeatable trading plan.
Integrating AMT into Your OpenSwingTrading Workflow
Real, lasting success in swing trading isn't about finding a single magic indicator. It’s about building a solid, repeatable process. The true power of auction market theory comes to life when you stop seeing it as just another chart tool and start weaving it into a complete, top-down workflow.
For traders in 2026, this means marrying the granular, 'micro' story of a single stock's auction with the 'macro' context of the entire market.
This is exactly where the combination of Auction Market Theory and a platform like OpenSwingTrading becomes so effective. AMT gives you the precision to pinpoint your entries and exits. OpenSwingTrading makes sure you're applying that precision to the right stocks in the right sectors at the right time.
When you align your trades with broad institutional momentum, your odds of catching those powerful, multi-day moves go up dramatically.
The Three-Step Top-Down Approach
The best part? This professional-grade process can be boiled down to a focused, 15-minute daily routine. It’s all about working smarter, not harder, by letting data do the heavy lifting for you.
Here’s a simple, three-step approach to make it happen.
Step 1: Get a Read on Broad Market Health
Before you even glance at an individual stock chart, your first question should be simple: "Is this a good time to be taking on risk?" OpenSwingTrading’s market health indicators provide a quick, objective answer.
By checking things like market breadth and risk-on/risk-off signals, you instantly get a feel for whether big money is flowing into the market or pulling back to the sidelines. This one step can save you a world of hurt by keeping you out of choppy, unfavorable conditions.
Step 2: Pinpoint the Strongest Sectors
Once you know the overall market is on solid footing, the next question is, "Where is the money going?" Capital is always rotating, and you want to be fishing where the action is.
OpenSwingTrading’s sector and industry group rankings show you exactly which areas are attracting institutional money and showing the most relative strength. This instantly narrows your focus from thousands of possibilities down to a handful of high-potential groups.
This top-down filtering is a game-changer for open swing traders. Instead of randomly hunting for setups, you’re letting the market’s own momentum guide you to the areas with the highest probability of success. It’s about focusing your time and capital where it matters most, creating a stress-free and more profitable trading experience.
From Macro Context to Micro Execution
With your high-level view locked in, it's time to drill down and find the best individual stocks to trade.
Step 3: Apply AMT for Precision Timing
Armed with a shortlist of the market's strongest stocks from the hottest sectors, you can finally pull up your charts. This is where you put on your Auction Market Theory hat and analyze the individual profiles of these leaders.
You're looking for those clean, actionable setups we discussed earlier—a breakout from a value area, a failed auction reversal, or a potential acceleration through a low-volume zone.
This final step connects the "what" (a strong stock) with the "when" (a prime entry point). You’re no longer just trading a random pattern; you're trading a confirmed market leader at the precise moment its auction dynamics signal an imbalance in your favor.
AMT and OpenSwingTrading Synergy
The table below breaks down how these two layers of analysis give you a complete trading picture, with each tool providing a distinct but complementary piece of the puzzle.
| Analysis Aspect | Auction Market Theory (Micro View) | OpenSwingTrading (Macro View) |
|---|---|---|
| Focus | Price acceptance or rejection at specific levels on a single stock's chart. | Overall market health and the flow of capital between sectors. |
| Purpose | To find precise entry, exit, and price target points for a specific trade. | To identify high-probability trading environments and the strongest areas of the market. |
| Actionable Question Answered | "Is now the right time to enter or exit this specific stock?" | "Is this the right stock, in the right sector, to be watching right now?" |
By following this simple three-step process, you build a robust trading plan that stacks multiple edges in your favor. It transforms Auction Market Theory from a fascinating concept into a powerful, practical part of your daily routine.
Common Mistakes to Avoid When Using AMT
Getting started with Auction Market Theory feels like putting on a new pair of glasses—suddenly, you see the market's structure in a whole new light. But with that new perspective comes the risk of a few common mistakes. Steering clear of these traps from the get-go will save you a ton of frustration and help you get comfortable with the framework much faster.
Remember, the goal is to read the market's story, not just to hunt for patterns. Too many traders treat AMT like a mechanical signal generator, missing the nuance of the auction process. Avoiding these classic blunders is the key to making AMT work for your swing trading in 2026.
Mistake 1: Over-Analyzing a Single Day
It's easy to get lost in the weeds of a single day's market profile. This is probably the most common mistake I see. A one-day profile is just one chapter in a much bigger book; taken alone, it can be full of noise and false signals, tricking you into thinking a small consolidation is a major top.
As a swing trader, context is king. The real power of AMT comes from watching how value evolves over several days, weeks, or even months.
An actionable insight for swing traders is to use a composite profile, which blends the auction data from an entire week. This gives a much clearer picture of where the big players have agreed on price, filtering out the daily static and highlighting the real, institutionally-defended levels that matter for a swing trade.
Mistake 2: Forcing Trades in Balanced Markets
We've all been there—bored, watching a quiet market, and feeling the itch to do something. But trying to force a trade in a balanced market is a recipe for disaster. When value areas stack on top of each other day after day, the market is telling you it's found a temporary equilibrium. Buyers and sellers are content.
Fighting that balance is like trying to paddle upstream in a lazy river. It's a lot of work for very little reward.
Instead, a balanced market is your cue to prepare, not to trade. This is the perfect downtime to fire up a tool like OpenSwingTrading and run your scans for relative strength leaders.
- Build Your Watchlist: Use the quiet time to find the strongest stocks in the hottest sectors.
- Set Your Traps: Place alerts at the high and low of the balance area.
- Wait for the Break: Don't act until one side—buyers or sellers—shows decisive initiative and pushes the market out of its comfort zone.
This patient, disciplined approach means you're ready with a list of A+ candidates the moment a real opportunity emerges, rather than being stuck nursing a choppy, low-conviction trade. You're simply waiting for the auction to tell you when it's time to go.
A Few Final Questions on Auction Market Theory
To wrap things up, let's tackle some of the most common questions traders have when they first encounter auction market theory. Getting these ideas straight will give you a much firmer footing as you start weaving these concepts into your trading in 2026.
Think of this framework less as a set of rigid rules and more as a way to read the story the market is telling you, day in and day out.
How Is This Different From Regular Technical Analysis?
Most standard technical analysis is built on price patterns—things like head-and-shoulders, flags, or double tops. These can be helpful, but they don't really explain the why behind a price move. Auction market theory digs deeper, looking at the auction process itself through the lens of volume and time.
So instead of just seeing a breakout, AMT helps you understand why it's happening. You see the market actively rejecting an old value area and aggressively seeking a new one. It brings objective structure to otherwise subjective patterns, giving swing traders a much clearer read on the market's real conviction.
Isn't Auction Market Theory Just for Day Traders?
Not at all. While day traders are often glued to intraday profiles, the core principles of balance and imbalance are universal. They work on any timeframe. For a swing trader, the real magic often comes from analyzing composite profiles that span an entire week or even a month.
An actionable insight is that these longer-term profiles cut through the daily noise and clearly show you the major value areas where institutions have been putting money to work. This is the perfect way to spot the heavy-duty support and resistance levels that will define a multi-day or multi-week swing trade, leading to larger, more profitable moves.
How Long Does It Take to Get Good at This?
Like any real skill, it takes time and practice. The good news? You can start applying the foundational ideas almost immediately. The key is to keep it simple at first. Don't get bogged down trying to master every single nuance from day one.
Here’s an actionable way to start:
- Find Balance: Just start by looking for those sideways consolidations where value areas overlap for a few days.
- Spot Imbalance: Then, watch for a clean, decisive move away from that balanced area.
- Mark Key Levels: Make a note of the Point of Control (POC) and the edges of the value area. These are your new reference points.
Focusing on just these core building blocks will sharpen your ability to see the market's structure and anticipate its next move. That’s a massive edge for any swing trading strategy.
Do I Need Special Software to Use AMT?
While dedicated market profile software gives you the most granular view, you absolutely don't need it to get started. You can apply the core concepts using the standard volume-by-price indicators found on most charting platforms, including TradingView. This tool will clearly show you high and low volume nodes, which is all you need to begin identifying balance areas.
The goal isn't to become a profiling guru overnight. For swing traders, the real win is training your eye to see the market as it truly is: a continuous two-way auction. That’s a perspective that will pay dividends for the rest of your trading career.
Ready to stop chasing random patterns and start trading with an institutional edge? OpenSwingTrading provides the data-driven macro view you need to find high-momentum stocks, so you can apply your AMT skills where they matter most. Discover your next high-conviction trade and begin your 7-day free trial.