Best Swing Trading Strategies for 2026: Proven Rules & Charts
Discover the best swing trading strategies for 2026: practical rules, chart tips, and risk management to boost your trading.
Welcome to your definitive guide for navigating the 2026 stock market. The landscape is constantly shifting, but the principles of profitable swing trading remain rooted in discipline, process, and a clear strategic edge. This article cuts through the noise to deliver a curated list of the best swing trading strategies, providing actionable, rules-based frameworks you can implement today. We will move beyond generic advice and dive into the mechanics of each approach, detailing precise entry triggers, exit rules, and risk management protocols.
You will learn how to identify high-probability setups across various market conditions, from strong uptrends to range-bound environments. We'll explore powerful techniques like momentum breakouts, trend-following pullbacks, and sector rotation, equipping you with a versatile toolkit. A key benefit of mastering these strategies is their time efficiency; you can manage a portfolio of swing trades in just a few minutes each day, making it a perfect fit for a busy lifestyle. Each strategy is broken down into a practical system, complete with real chart examples and specific screening criteria for platforms like TradingView and Finviz.
A core theme is the power of context: understanding overall market health and institutional capital flows before selecting individual stocks. This is where modern tools provide a critical advantage, helping traders focus their capital only when conditions are favorable and on stocks showing true relative strength. Whether you're refining an existing approach or building a new one from scratch, these proven strategies offer a blueprint for developing a more systematic and confident trading routine in 2026. This guide is designed for immediate application, helping you build a professional-grade process that fits a busy schedule.
1. Relative Strength and Momentum Trading
Relative Strength (RS) and Momentum trading is one of the best swing trading strategies because it focuses on a simple, powerful market truth: leaders tend to keep leading. This strategy involves identifying stocks that are outperforming the broader market (like the S&P 500) or their specific sector. The core principle is that strength begets more strength; stocks showing superior price performance often continue on that trajectory, making them prime candidates for swing trades lasting several days to weeks. This approach is inherently efficient, allowing you to focus only on the market's strongest names.
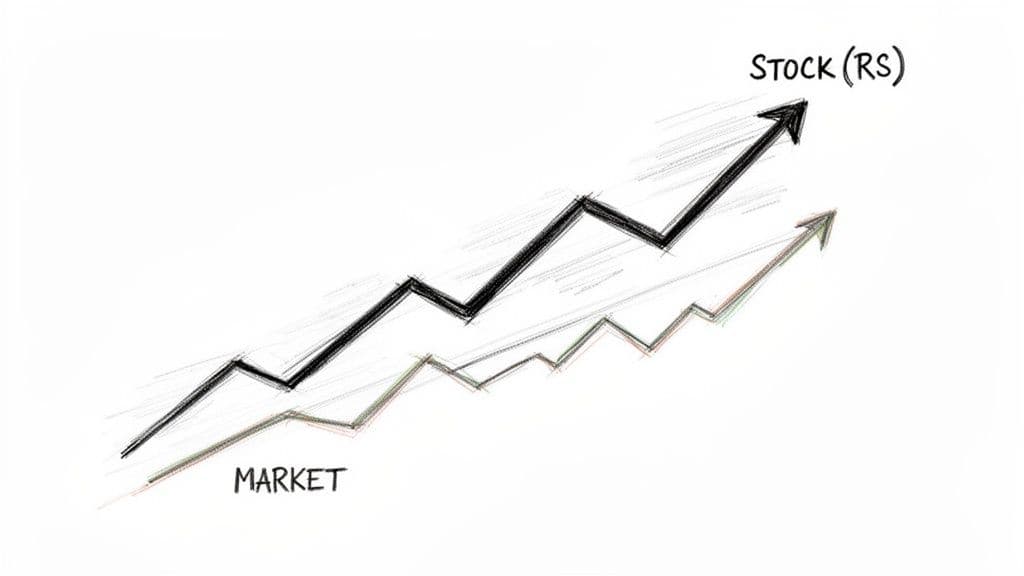
This approach moves beyond just finding a stock in an uptrend. It quantifies which uptrending stocks are the strongest. For instance, during the AI-driven rally of 2026, many tech stocks rose, but semiconductor leaders like NVDA and AMD showed explosive relative strength, delivering far greater returns than the overall Nasdaq index. This is where data-driven screening becomes a significant edge, saving countless hours of manual research.
How to Implement This Strategy
- Screening: Use a scanner like OpenSwingTrading's daily rankings to instantly filter for stocks with high, accelerating relative strength. These systems do the heavy lifting by comparing thousands of stocks against market benchmarks. You can also use Finviz or TradingView to screen for stocks hitting new 52-week highs or those outperforming the SPY over the past three to six months.
- Entry Signal: A high RS ranking is your starting point, not the final trigger. Look for a low-risk entry, such as a breakout from a consolidation pattern (a "base") or a minor pullback to a key moving average like the 10-day or 20-day EMA. The goal is to buy strength, but not chase it at an extended price.
- Exit Signal: Sell when momentum falters. This could be a break below a key moving average, a sharp drop in its RS ranking, or the formation of a bearish chart pattern. A trailing stop loss set 8-10% below your entry or just under a recent swing low can protect profits.
- Market Context: This strategy thrives in confirmed market uptrends. When overall market breadth is strong, high RS stocks are more likely to follow through on their breakouts. Avoid deploying this strategy heavily during choppy or bearish market phases.
2. Breakout Trading Above Resistance
Breakout trading is one of the best swing trading strategies for capturing explosive price moves. It centers on identifying a significant resistance level, which acts as a "ceiling" that has previously stopped a stock from moving higher, and then buying the moment the price breaks decisively above it. This strategy operates on the principle that a break of major resistance signals a powerful shift in the supply-and-demand dynamic, attracting a rush of new buyers and forcing short-sellers to cover their positions, which fuels a strong upward trend. The clear entry and exit points make it a very defined and less subjective way to trade.
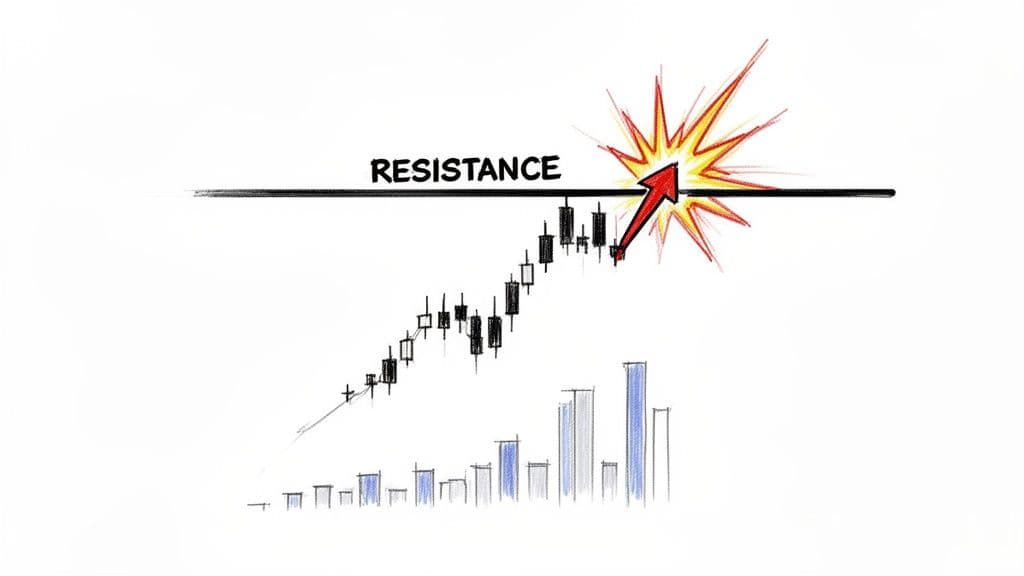
The key to a successful breakout is volume confirmation. A true breakout occurs on a surge in trading volume, indicating strong institutional conviction behind the move. Without this volume, the breakout is more likely to be a "fakeout" that quickly reverses. For example, when a growth stock like Palantir (PLTR) broke above its key $25 resistance level in a previous bull cycle, the move was accompanied by massive volume, signaling the start of a sustained rally that swing traders capitalized on for weeks.
How to Implement This Strategy
- Screening: Use stock screeners like Finviz or TradingView to find stocks trading near their 52-week highs or approaching a well-defined resistance level. Filter for stocks that are also building a "base" or consolidating sideways, as this often precedes a powerful breakout. High relative strength is a key complementary filter.
- Entry Signal: The primary entry signal is a daily candle closing decisively above the resistance level on higher-than-average volume. An aggressive entry can be taken as the price breaks the level intra-day, but waiting for the close provides greater confirmation and helps avoid false moves.
- Exit Signal: Place an initial stop-loss just below the breakout level, typically 2-3% below. As the trade moves in your favor, you can use a trailing stop or sell when the price breaks below a key short-term moving average, like the 10-day or 20-day EMA, which signals that momentum is waning.
- Market Context: This strategy performs best in a healthy, bullish market environment. Using a tool like OpenSwingTrading's market breadth indicators is crucial; only pursue breakouts when the data confirms broad market participation. Trading breakouts in a choppy or bearish market often leads to failed moves and frustrating losses.
3. Sector and Thematic Rotation Trading
Sector and Thematic Rotation Trading is one of the best swing trading strategies because it aligns your trades with the powerful flow of institutional capital. Instead of picking stocks in a vacuum, this strategy involves identifying which sectors (like technology, healthcare, or financials) or investment themes (like AI, clean energy) are attracting the most money and outperforming the broader market. The principle is that a rising tide lifts all boats; stocks within a leading sector have a statistical tailwind, increasing their probability of success.
This macro-focused approach provides critical context for stock selection and is a massive time-saver. For example, during the AI-driven rally in 2026, trying to trade industrial stocks was a low-probability game. The real profits came from focusing on semiconductor and software companies like NVDA and AMD, which were at the heart of the market's strongest theme. By trading within the leading group, you are fishing in a pond stocked with hungry fish.
How to Implement This Strategy
- Screening: Use OpenSwingTrading's sector and thematic trend analytics to instantly identify which groups are showing the most strength. These tools do the heavy lifting by analyzing capital flows and relative performance. Alternatively, use ETF performance on Finviz (e.g., comparing XLK for tech vs. XLE for energy) to spot leadership changes.
- Entry Signal: Once you've identified a leading sector or theme, drill down to find the strongest stocks within that group. Look for individual stocks breaking out from a consolidation pattern or pulling back to a key moving average, just as you would with any other strategy. The key difference is your watchlist is pre-filtered for maximum tailwind.
- Exit Signal: Exit signals can be both stock-specific and theme-specific. Sell an individual position if it breaks a key support level or its momentum fades. More importantly, consider reducing exposure to the entire theme if the sector's relative strength begins to weaken or institutional capital starts rotating elsewhere.
- Market Context: This strategy is powerful in most market environments, as rotations happen even during corrective phases. However, it's most effective when the overall market has a clear direction. During periods of extreme volatility or bearish trends, even leading sectors can struggle, so risk management remains paramount.
4. Support and Resistance Level Trading
Support and Resistance trading is a cornerstone of technical analysis and one of the best swing trading strategies for its reliability and clear logic. The strategy is built on the idea that prices often respect historical levels where buying or selling pressure was previously significant. These levels act as psychological and technical barriers where traders anchor their decisions, creating predictable price reactions. A key benefit is the excellent risk-reward ratio this strategy often provides.
This approach helps traders identify high-probability, low-risk entry and exit points. For swing traders, buying a stock as it pulls back and successfully tests a key support level in an established uptrend offers a defined risk-reward scenario. For example, during its uptrend in 2026, many traders noted how Apple consistently found buyers at its 50-day moving average, a dynamic support level that provided repeated swing trading opportunities.
How to Implement This Strategy
- Screening: Identify stocks in a confirmed uptrend that are pulling back. Use a scanner like Finviz or TradingView to find stocks trading above their 200-day moving average but approaching their 50-day moving average. Manually draw horizontal support and resistance lines on your charts based on recent swing highs and lows, which are the most relevant price memory zones.
- Entry Signal: The ideal entry is a bounce off a well-defined support level. This could be a horizontal price level, a key moving average, or a major psychological number (like $100). Look for confirmation, such as a bullish candlestick pattern (like a hammer or bullish engulfing) on increased volume, signaling that institutional buyers are stepping in.
- Exit Signal: Your initial profit target should be the next significant resistance level. Set a stop loss just below the support level you entered at, typically 2-3% below the line. If the price breaks cleanly below the support level with heavy volume, it’s a clear signal to exit the trade immediately, as the support has failed.
- Market Context: This strategy performs best when the overall market is in a healthy uptrend, which you can confirm with market breadth indicators. Buying pullbacks to support is a lower-probability trade in a choppy or bearish market, as support levels are more likely to break. Avoid trying to "catch a falling knife" by buying support in a strong downtrend.
5. Moving Average Crossover and Trend Following
The Moving Average (MA) Crossover is a classic trend-following strategy that remains one of the best swing trading strategies for its clarity and effectiveness. It operates on the simple premise that momentum is shifting when a shorter-term, faster-moving average crosses above a longer-term, slower one. This event, often called a "Golden Cross" when the 50-day MA crosses the 200-day MA, signals the potential start of a new, sustainable uptrend. This hands-off approach allows traders to capture the majority of a trend with minimal intervention.
This method provides an objective, rules-based way to identify and ride major trends. For example, the bullish 50/200-day MA crossover on the S&P 500 in early 2026 preceded a multi-month rally, offering a clear signal to favor long positions. Similarly, growth stocks like AMZN and NVDA displayed powerful crossovers in 2026, launching them into sustained uptrends that rewarded trend-following traders. The strategy's strength lies in filtering out market noise to focus on the dominant trend direction.
How to Implement This Strategy
- Screening: Use a scanner on platforms like TradingView or Finviz to find stocks where the 20-day EMA has recently crossed above the 50-day EMA for shorter-term trades, or the 50-day SMA has crossed the 200-day SMA for longer-term swings. Focus on stocks that also show increasing volume on and after the crossover day, which validates the move.
- Entry Signal: The crossover itself is the primary signal. An ideal entry occurs shortly after the crossover is confirmed, preferably on a small pullback or consolidation. Avoid chasing a stock that has already run up significantly post-crossover. Confirmation from other indicators, like a rising RSI (above 50), adds strength to the signal.
- Exit Signal: The most straightforward exit is the reverse crossover, known as a "Death Cross" (e.g., 50-day MA crossing below the 200-day MA). For a more proactive approach, exit if the price breaks decisively below a key moving average (like the 50-day EMA) or a recent major swing low.
- Market Context: This strategy excels in markets with clear, trending characteristics. During choppy, range-bound periods, MA crossovers can produce frequent false signals ("whipsaws"). Confirm the trade's viability by checking that the broader market, as tracked by OpenSwingTrading's market breadth data, also supports a new uptrend.
6. Earnings Surprise and Post-Earnings Momentum
Earnings Surprise and Post-Earnings Momentum is a powerful strategy because it targets stocks undergoing a fundamental repricing. This approach involves buying stocks that significantly beat earnings estimates and then demonstrate strong upward momentum in the days and weeks following the announcement. The core principle is that a positive earnings surprise reduces uncertainty and attracts large institutional buyers, whose sustained purchasing pressure can fuel a trend lasting for weeks, making it an ideal setup for a swing trade. The catalyst-driven nature of these trades often leads to faster and more decisive moves.
This strategy capitalizes on the market's delayed reaction to new information. For instance, when Palantir (PLTR) reported multiple earnings beats in its early years, the stock didn't just pop for one day; it ignited multi-week rallies as the market gradually digested its growth potential. The initial gap up is just the beginning; the real swing trading opportunity lies in the sustained follow-through momentum.
How to Implement This Strategy
- Screening: Use a scanner like OpenSwingTrading to filter for stocks that have recently reported a significant earnings beat and also show rising relative strength. This dual-filter approach isolates fundamentally strong companies with confirmed technical momentum. You can also build a dedicated earnings watchlist in TradingView or use Finviz's screener to find companies that gapped up on high volume after their report.
- Entry Signal: Avoid the extreme volatility of the earnings day itself. A safer entry is to wait 3-5 days for the initial price action to consolidate. Look for a breakout from a tight flag or pennant pattern that forms after the initial gap up. An entry above this small consolidation signals that the momentum is likely to continue.
- Exit Signal: Place an initial stop loss just below the low of the post-earnings consolidation pattern. Set a profit target near the next major technical resistance level. It's often wise to take partial profits as the stock extends and trail your stop on the remaining position. Exit the trade entirely as the next earnings announcement approaches to avoid binary event risk.
- Market Context: This is one of the best swing trading strategies in a healthy bull market where positive news is rewarded with sustained buying. Confirm that the broader market and the stock's specific sector are also showing strength before entering a post-earnings trade, as this increases the probability of a successful follow-through.
7. Pullback and Retracement Trading in Uptrends
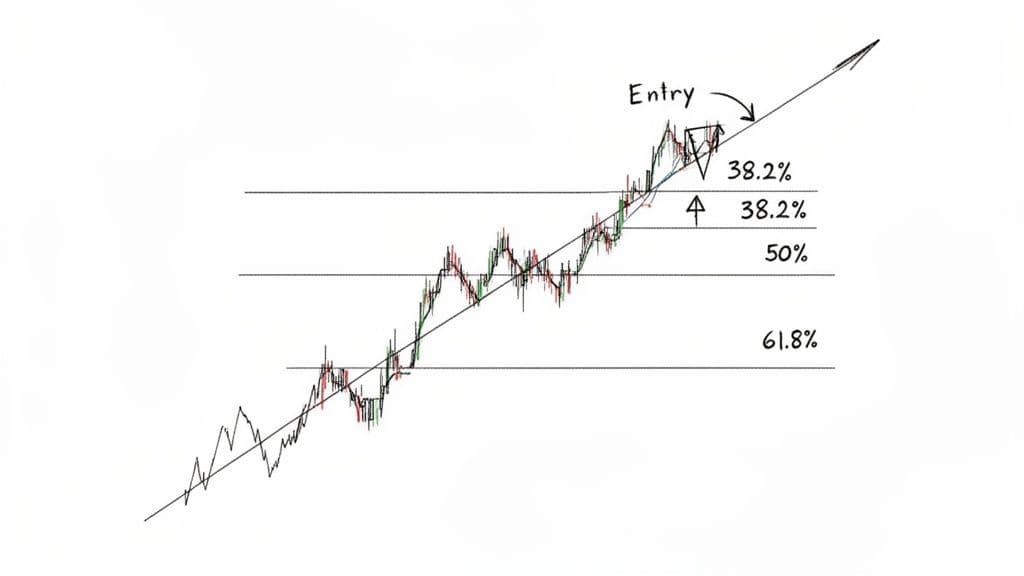
Pullback and retracement trading is one of the best swing trading strategies for traders who miss an initial breakout but still want to join a strong, established trend. The strategy is built on the principle that healthy uptrends don't move in a straight line; they breathe, pulling back to key support levels before resuming their ascent. This approach provides a lower-risk entry point compared to chasing an extended stock, allowing you to buy strength at a discount.
The key is identifying a constructive, low-volume pullback versus a high-volume selloff that signals a potential trend reversal. During the robust growth sector rally of 2026, many leading stocks followed this pattern, offering multiple entry opportunities on dips to their 20-day or 50-day moving averages. Similarly, assets like Bitcoin have historically provided powerful entries on retracements to key support during their bull market phases. By waiting for a dip, you get a better risk-reward setup.
How to Implement This Strategy
- Screening: A daily review of high-ranking relative strength stocks is the perfect starting point. Use OpenSwingTrading’s rankings to quickly identify market leaders, then watch these specific names for pullbacks. You can also use screeners like TradingView to find stocks in confirmed uptrends (e.g., price above the 50-day and 200-day moving averages) that have pulled back 5-15% from recent highs.
- Entry Signal: Look for an entry as the stock finds support at a logical level. This could be a key moving average (like the 20-day EMA), a prior breakout point, or a Fibonacci retracement level (often the 38.2% or 50% level). Crucially, this pullback should occur on declining volume, indicating that selling pressure is drying up, not intensifying. A bullish candlestick pattern at support confirms the entry.
- Exit Signal: Set a stop loss just below the swing low created by the pullback or below the key support level you used for entry. Your initial profit target should be the prior high, where the stock may face resistance. A trailing stop can be used to capture further gains if the stock breaks out to new highs.
- Market Context: This strategy works best in a confirmed market uptrend when overall market breadth is healthy. Buying pullbacks in a choppy or bearish market is risky, as these dips can easily turn into deeper corrections. Always confirm the broader market is supportive before entering a pullback trade.
8. Volume Analysis and Accumulation/Distribution
Volume analysis is a cornerstone of swing trading because it reveals the conviction behind price moves. This strategy focuses on a critical market dynamic: price follows volume. By analyzing trading volume patterns, traders can determine if institutional "smart money" is accumulating (buying) or distributing (selling) shares. The principle is that significant price trends are always backed by significant volume, making it an indispensable tool for confirming the validity of a move. This adds a crucial layer of confidence to your trading decisions.
This method goes beyond simple price action to answer the question, "How much participation is driving this trend?" For example, a stock breaking out to new highs on weak, declining volume is a red flag suggesting a lack of institutional support. Conversely, a breakout on volume that is 150% or more of its daily average, like Apple's surge past key resistance levels in 2026, signals strong institutional conviction and a higher probability of follow-through.
How to Implement This Strategy
- Screening: Use a scanner like TradingView or Finviz to find stocks with unusual volume. Set filters for "Volume > 1.5x Average Volume" and "Price near 52-week high" to identify potential breakout candidates. You can also screen for stocks showing consistent accumulation patterns, such as multiple up days on above-average volume.
- Entry Signal: Look for a price breakout from a consolidation pattern that is confirmed by a significant volume surge. For instance, enter a trade when a stock clears a resistance level on at least double its 20-day average volume. This signals that big players are stepping in to push the price higher.
- Exit Signal: Sell when you see signs of distribution. This includes price making new highs on noticeably weaker volume (divergence) or a sharp price drop on a massive volume spike, which often indicates panic selling or institutional distribution. A break below a key moving average on high volume is also a strong exit signal.
- Market Context: Volume analysis is effective in all market conditions but is especially powerful for confirming breakouts in an uptrending market. When combined with other metrics, like those from OpenSwingTrading's sector trend data, it creates a high-conviction setup. A stock showing high relative strength and a volume-confirmed breakout in a leading sector is one of the best swing trading strategies available.
9. Market Breadth-Driven Selection and Confirmation
Market Breadth-Driven Selection is one of the best swing trading strategies because it forces you to trade in harmony with the overall market tide, not against it. This strategy uses internal market health indicators, like the Advance/Decline (A/D) Line or the percentage of stocks above their 200-day moving average, as a primary filter. The core principle is that individual stock breakouts are far more likely to succeed when the majority of stocks are participating in the rally. This top-down approach significantly improves your trade win rate.
This approach acts as a powerful risk management tool. For instance, in early 2026, even as major indices like the Nasdaq hit new highs, a declining A/D line signaled that fewer and fewer stocks were actually driving the gains. This "negative divergence" warned traders of underlying weakness, helping them avoid false breakouts and protect capital before the subsequent market correction. By prioritizing market health, you avoid buying strong stocks in a weak, deteriorating environment.
How to Implement This Strategy
- Screening: Make market breadth your first daily check. Use a tool like OpenSwingTrading's breadth analytics to get a quick, clear read on market health. You are looking for confirmation: a rising A/D line, an increasing number of stocks making new 52-week highs, and over 50-60% of stocks trading above their key long-term moving averages. Only after confirming strong breadth do you screen for individual stock setups.
- Entry Signal: Only take long positions when market breadth is strong and confirming the index's price action. For example, enter a high-momentum stock breaking out of a base only if the NYSE A/D Line is also trending upward. This confluence dramatically increases the probability of a successful follow-through.
- Exit Signal: Deteriorating breadth is your early warning to tighten stops or take profits, even if your individual stock still looks good. If the percentage of stocks above the 50-day MA falls below 50% or the A/D line breaks its uptrend, it’s a signal to reduce risk across your portfolio.
- Market Context: This strategy is your guide to market context itself. It tells you when to be aggressive (strong, expanding breadth) and when to be defensive or in cash (weak, contracting breadth). It's a universal framework that improves the performance of nearly any other long-side strategy.
10. Institutional Capital Flow and Smart Money Tracking
Following the "smart money" is one of the most powerful and predictive swing trading strategies available. This approach involves identifying where large institutions like hedge funds, mutual funds, and pension funds are deploying their capital. Since these players move billions of dollars, their positioning often precedes major price moves, creating a wake that savvy swing traders can ride. The core idea is that significant accumulation by institutions validates a stock's or sector's fundamental strength long before it becomes common knowledge. This provides a clear edge over purely reactive technical trading.
This strategy moves beyond simple technical analysis by adding a layer of conviction. For instance, the massive institutional accumulation in the AI and semiconductor sectors throughout 2025 laid the groundwork for the explosive rallies seen in early 2026. Retail traders who only followed price charts missed the early, low-risk entries. By tracking sector ETF inflows and fund positioning, traders could see where capital was concentrating and position themselves accordingly, capturing the majority of the trend.
How to Implement This Strategy
- Screening: Use a tool like OpenSwingTrading's institutional capital flow analytics, which highlights the sectors and themes experiencing the highest fund inflows. This provides a top-down view of where smart money is moving. You can supplement this by monitoring weekly fund flow reports from sources like Morningstar or tracking the holdings of major sector ETFs (e.g., XLK for tech, XLE for energy) to spot accumulation patterns.
- Entry Signal: The signal is a two-part confirmation. First, identify a sector with strong and accelerating institutional inflows. Second, find a leading stock within that sector that is also showing high relative strength and breaking out from a technical consolidation pattern. This combination ensures you are buying a leader in a theme that has institutional backing.
- Exit Signal: Exit when the narrative falters. This is often signaled by a reversal in fund flows, where a sector begins to see consistent outflows. On a stock-specific level, a break of a key long-term moving average (like the 50-day SMA) or a significant drop in its relative strength ranking indicates that the institutional support may be waning.
- Market Context: This strategy excels during periods of clear sector rotation, which are common in both bull and range-bound markets. It is less effective in a broad market panic where all sectors are being sold off indiscriminately. The goal is to catch the next leading theme, not the last one.
Top 10 Swing Trading Strategies Comparison
| Strategy | Implementation Complexity (🔄) | Resource Requirements (⚡) | Expected Outcomes (⭐) | Ideal Use Cases (📊) | Key Advantages & Tips (💡) |
|---|---|---|---|---|---|
| Relative Strength and Momentum Trading | 🔄 Moderate — needs RS ranking and breadth confirmation | ⚡ Medium — daily price data, ranking tools, charting (OpenSwingTrading/TradingView) | ⭐⭐⭐⭐ — High in broad uptrends; catches leaders early | 📊 Swing entries in strong market rallies; sector leaders | 💡 Objective filters; use breadth + RS; stops 5–10% below swing low |
| Breakout Trading Above Resistance | 🔄 Moderate — requires level identification and volume validation | ⚡ Low–Medium — charting, volume data, breakout alerts | ⭐⭐⭐⭐ (when confirmed) — High with volume & breadth; false breakouts common | 📊 Quick momentum entries after news/technical clears | 💡 Wait for daily close and volume confirmation; stop ~2–3% below breakout |
| Sector and Thematic Rotation Trading | 🔄 High — macro/sector analysis and daily monitoring | ⚡ High — sector analytics, fund-flow data, thematic research | ⭐⭐⭐⭐ — Improves odds by concentrating in leadership themes | 📊 Multi-week to multi-month thematic allocations; portfolio tilts | 💡 Follow institutional flows; focus 1–2 top themes; review monthly |
| Support and Resistance Level Trading | 🔄 Low–Moderate — chart reading and level selection | ⚡ Low — price/volume data and moving averages | ⭐⭐⭐ — Clear R/R but prone to false breaks | 📊 Pullback entries, range trading, trend confirmations | 💡 Use MAs, confirm with volume/breadth; stops 2–3% below support |
| Moving Average Crossover & Trend Following | 🔄 Low — mechanical crossover rules | ⚡ Low–Medium — MA calculations, optional breadth filter | ⭐⭐⭐⭐ — Effective in trending markets; whipsaws in choppy markets | 📊 Long-term trend capture; systematic strategies | 💡 Use MA alignment and breadth confirmation; faster MAs for quicker entries |
| Earnings Surprise & Post-Earnings Momentum | 🔄 Moderate — event tracking and post-ER windowing | ⚡ Medium — earnings calendar, real-time data, RS filters | ⭐⭐⭐⭐ — Strong when combined with RS/breadth; volatile | 📊 Multi-week post-earnings momentum trades | 💡 Enter 3–5 days post-ER, buy beats with rising RS, size for volatility |
| Pullback & Retracement Trading in Uptrends | 🔄 Moderate — requires trend confirmation and retracement analysis | ⚡ Low–Medium — charting, Fibonacci/MA overlays | ⭐⭐⭐⭐ — Lower-risk entries within intact trends | 📊 Swing entries for missed breakouts in strong sectors | 💡 Buy pullbacks only in RS leaders; declining volume on pullback; stop under swing low |
| Volume Analysis & Accumulation/Distribution | 🔄 Moderate — interpretation of volume patterns | ⚡ Medium — reliable volume feeds, A/D or VP tools | ⭐⭐⭐⭐ — Reveals institutional activity; validates moves | 📊 Validating breakouts; early reversal warnings | 💡 Compare to 20-day avg; seek rising price on increasing volume; combine with RS/breadth |
| Market Breadth-Driven Selection & Confirmation | 🔄 Moderate — breadth calculations and daily checks | ⚡ Medium — A/D lines, percent above 200‑day MA, new highs/lows | ⭐⭐⭐⭐ — Very effective filter; reduces whipsaws and false trades | 📊 Market-regime assessment before individual stock selection | 💡 Use as first filter; trade only when A/D rising and sufficient % above 200‑day MA |
| Institutional Capital Flow & Smart Money Tracking | 🔄 High — synthesize fund flows, options, insider and positioning data | ⚡ High — professional data sources and analytics (often paid) | ⭐⭐⭐⭐ — High conviction if done well; requires patience | 📊 Multi-week institutional-led trend entries and theme discovery | 💡 Follow fund flows + RS alignment; enter on confirmed accumulation; expect longer holds |
Building Your Personal Swing trading Playbook for 2026
We've explored ten of the best swing trading strategies, moving from the macro view of market breadth and sector rotation down to the granular details of breakout patterns and pullback entries. Each framework, whether it's trading post-earnings momentum or following institutional capital flows, offers a distinct edge. However, the ultimate key to success in 2026 and beyond isn't about finding a single "holy grail" strategy; it's about building a personalized, dynamic playbook that adapts to changing market conditions.
The strategies detailed in this article are not mutually exclusive. In fact, the most robust trading systems often layer several concepts together. A powerful trade setup might emerge when a stock showing high relative strength (Strategy #1) pulls back to a key moving average (Strategy #7) within a leading sector (Strategy #3), all while market breadth confirms underlying strength (Strategy #9). This confluence of factors creates a high-probability opportunity that isolated signals simply cannot match. This ability to combine strategies creates a significant advantage, allowing for more confident and robust decision-making.
From Theory to Consistent Application
Your primary goal now is to bridge the gap between understanding these strategies and executing them with discipline. A common pitfall is "strategy hopping," where a trader abandons a system after a few losses, only to jump to the next shiny object. This cycle prevents mastery and erodes confidence. To avoid this, you must commit to a structured process of selection, testing, and refinement.
Start by choosing just two or three strategies from this list that genuinely resonate with your personality and time commitment. Are you patient enough for pullback and retracement trades, or does the explosive price action of breakout trading better suit your temperament? Once you’ve made your selection, the real work begins.
Your Action Plan for Mastery:
- Backtest and Forward-Test: Use historical charts and a trading journal to see how your chosen strategies performed over the past six to twelve months. More importantly, forward-test them in a simulated or small-sized account to see how you execute them in real-time. This builds invaluable screen time and psychological resilience.
- Define Your Niche: You don't need to trade every stock. Focus on a specific universe, such as mid-cap tech stocks, industry-leading consumer brands, or commodity-related ETFs. Specialization helps you develop a deeper feel for how assets in your niche behave.
- Systemize Your Daily Routine: The 5–15 minute daily review is not just a suggestion; it's the bedrock of consistency. This routine forces you to evaluate the market environment first, before you even look for individual setups. Is the market in a clear uptrend, a choppy range, or a downtrend? This single data point dictates which strategies are even viable on any given day.
Integrating Data for a Decisive Edge
The most successful discretionary traders in 2026 will be those who augment their chart-reading skills with objective, data-driven insights. Relying solely on price patterns without understanding the underlying market context is like navigating without a compass. This is where modern tools become indispensable.
By integrating a data platform like OpenSwingTrading into your daily process, you transform your approach from reactive to proactive. Instead of manually hunting for candidates, you can instantly see which sectors have the most momentum, which stocks are exhibiting the highest relative strength, and where institutional capital is flowing. This allows you to focus your limited time and mental energy on analyzing only the highest-potential setups that align with the current market leadership. This disciplined, top-down approach is what separates consistently profitable traders from the crowd. It ensures you are always fishing in the right ponds, placing the odds firmly in your favor before you ever place a trade.
Ultimately, the best swing trading strategies are the ones you can execute flawlessly and consistently. The frameworks in this guide provide the blueprints. Now it's your turn to build the engine, test it rigorously, and drive it with unwavering discipline toward your trading goals.
Ready to stop guessing and start leveraging data to find the best swing trading candidates? OpenSwingTrading provides the essential market context, relative strength rankings, and sector leadership data you need to apply these strategies effectively in just minutes a day. Supercharge your trading process and gain a decisive edge by visiting OpenSwingTrading to learn more.