Build an Open Stocks Watchlist in 10 Minutes
A 10-minute, step-by-step guide to building an open stock watchlist you can share publicly—choose a simple stack, design a clean sheet, pull live prices with formulas or an API fallback, and publish with smart privacy settings.
Build an Open Stocks Watchlist in 10 Minutes
A 10-minute, step-by-step guide to building an open stock watchlist you can share publicly—choose a simple stack, design a clean sheet, pull live prices with formulas or an API fallback, and publish with smart privacy settings.
If your “watchlist” lives in five tabs, a brokerage app, and a half-updated note, you’re not tracking stocks—you’re chasing them. The result is missed price moves, forgotten thesis notes, and a list no one else can easily view.
This guide walks you through creating a lightweight, public-friendly watchlist in about 10 minutes. You’ll pick a minimal tool stack, build a readable spreadsheet layout, pull live prices fast (with a reliable backup), add quick research notes, and publish a clean link without leaking anything sensitive.
Decide Your Stack
You’re picking speed over perfection, so you can ship today. “Working” means a watchlist you can open, edit, and share as a link.
Working definition
Done looks like a simple table you can maintain without friction. Your watchlist includes ticker, last price, daily change, and a notes column like “earnings next week.” It also has a public URL you can send in Slack or drop into a doc.
If someone can open it on their phone and understand it, you’re finished.
Tool choices
Pick the fastest stack with the fewest moving parts. You’re optimizing for “I can edit this in 30 seconds.”
- Use Google Sheets for storage and editing
- Use a free quotes source for last price and change
- Use a share link for public access
- Add GitHub Pages for a clean landing page
- Skip a database until it hurts
Your goal is a link, not an app.
Data source rules
Free data is fine if you define your constraints upfront. You want no login for viewers, reasonable rate limits, and delays you can tolerate for a watchlist.
Expect tradeoffs, and plan for an API key if the provider requires one.
Create The Sheet
Build your table first so every formula, filter, and share link behaves predictably. Think of it like labeling wires before you power anything on.
Add core columns
Set up the columns once so you never fight your own sheet later.
- Add headers: Ticker, Name, Price, Change%, Updated, Notes, Link.
- Freeze the header row so labels stay visible.
- Turn on filters so you can sort without breaking ranges.
- Widen Ticker and Name to prevent ugly wraps.
- Set Link to plain text for clean pastes.
Do this now, and every import stays aligned instead of drifting.
Seed your tickers
A watchlist is only useful when tickers are consistent and scannable.
- Enter 10–20 tickers in the Ticker column, one per row.
- Normalize formats like “AAPL” instead of “aapl ”.
- Decide your convention, like “NASDAQ:AAPL” vs “AAPL”.
- Add a dropdown for Exchange if you need it, like NASDAQ, NYSE, LSE.
- Remove duplicates so your results don’t double-count.
If you can’t sort and scan tickers fast, the rest won’t save you.
Make it readable
Formatting is not decoration. It’s the difference between spotting a move and missing it.
Use conditional formatting so Change% turns green for gains and red for losses. Set Price to currency and Change% to percent, like “$182.13” and “-1.24%”.
When the sheet is readable at a glance, you’ll actually use it daily.
Pull Live Prices
Live prices make your watchlist feel “alive,” not stale. You’ll use a fast sheet formula first, then keep an API fallback ready for the day it flakes out.
Fastest formula route
Use GOOGLEFINANCE when it supports your symbol, because it’s the lowest-friction option. You’ll standardize tickers so the formula doesn’t choke on exchange quirks.
- Create a “Symbol” column with full tickers like
NASDAQ:AAPLorNYSE:KO. - Map raw tickers to full tickers using a lookup table (Ticker → Exchange:TICKER).
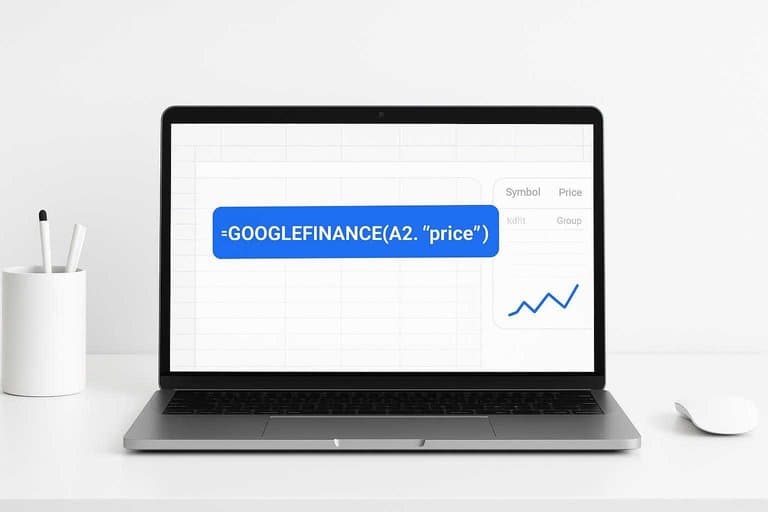
- Pull price with
=GOOGLEFINANCE(A2,"price")where A2 is your full ticker. - Pull daily change with
=GOOGLEFINANCE(A2,"changepct")and format as percent. - Add a timestamp column with
=NOW()and enable recalculation on change/hour.
If you can’t produce a full EXCHANGE:SYMBOL, you’re already in fallback territory.
Learn more about the GOOGLEFINANCE function in Google Sheets.
Fallback via API
APIs cover more symbols and fail less randomly, but you pay with setup and rate limits. Apps Script lets you fetch once, then write clean values into cells.
- Pick a source and endpoint (Stooq is simple; Alpha Vantage is broader).
- In Sheets, open Extensions → Apps Script, then create a
fetchQuotes()function. - Use
UrlFetchApp.fetch(url)to request quotes for a batch of tickers. - Parse the response (CSV/JSON), then
setValues()into your Price and Change columns. - Add a time-driven trigger to run every 5–15 minutes.
Do batch writes, not cell-by-cell updates, or your script becomes the bottleneck.
Refresh expectations
GOOGLEFINANCE updates on its own schedule, not yours, and it can cache aggressively. You’ll often see 2–20 minute delays, plus occasional “stuck” symbols.
Treat formulas as “near real-time,” not trading-grade. If you need predictable refresh, schedule your API script and cache results per run.
Add Quick Notes
Quick notes keep your watchlist honest. You want the “why” beside the ticker, not buried in a tab you never open. Think: “Earnings momentum, watch next report.”
Notes template
Use a tiny template so notes stay comparable across tickers. One line each keeps it fast and forces clarity.
- Thesis — why it works
- Catalyst — what changes soon
- Invalidation — what breaks it
- Target date — when you’ll revisit
When every row has an invalidation line, you stop “marrying” a stock.
One-click research links
Turn each ticker into a small research hub. You’ll click, scan, and return without leaving your workflow.
- Create a Yahoo link:
=HYPERLINK("https://finance.yahoo.com/quote/"&A2, "Yahoo"). - Create an SEC search:
=HYPERLINK("https://www.sec.gov/edgar/search/#/q="&A2, "SEC"). - Create a news link:
=HYPERLINK("https://www.google.com/search?q="&A2&"+stock+news", "News"). - Fill formulas down for the full ticker column.
- Optionally add an earnings calendar link per ticker.
If the links are one click away, you’ll actually do the pre-trade reading.
Keep it maintainable
You’re building a tool, not a one-off sheet. Guard your formulas so you don’t break them during a fast edit.
Put tickers in a dedicated input column, like column A. Keep every formula column to the right, then protect those ranges.
When tickers are the only editable area, your watchlist stays clean under pressure.
Publish It Open
You want a public watchlist that’s one click away, but edits stay locked down. The trick is sharing the view, not your workspace, like publishing a “read-only dashboard.”
Share settings
Set the sheet to public view without leaking anything else.
- Open the Sheet, click Share.
- Set General access to Anyone with the link.
- Change role to Viewer, not Commenter.
- Open the link in an incognito window and scan every tab.
If incognito shows more than your watchlist, you published your mess too.
Friendly public link
You can share the raw Sheet link, or wrap it in something cleaner.
- Create a GitHub repo named yourname.github.io.
- Add an index.html with a short description and a redirect.
- Push to GitHub, then open https://yourname.github.io.
- Replace the Sheet link later without changing what you’ve shared.
A stable link turns your watchlist into an asset you can reuse everywhere. (Here’s a quick method for adding a meta refresh redirect.)
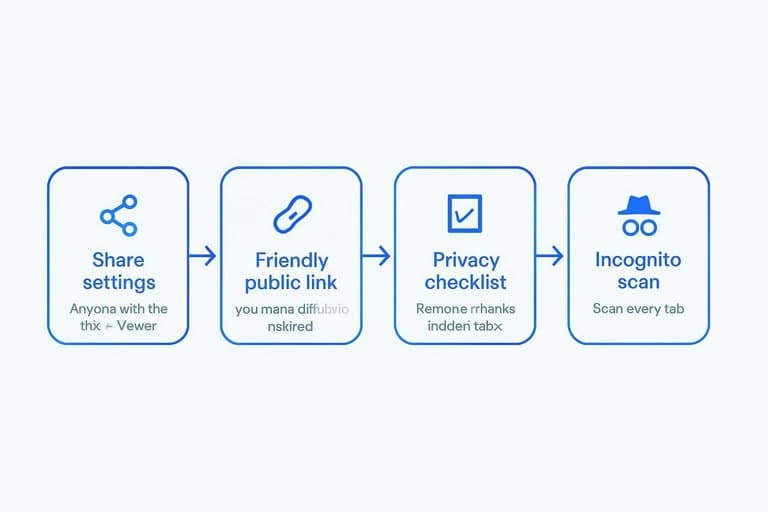
Privacy checklist
Do a fast scrub before you publish.
- Remove emails and collaborator names
- Delete hidden tabs and scratch sheets
- Strip account names and portfolio IDs
- Clear comments, notes, and suggestion threads
- Avoid file-history references in cells
Treat it like shipping a screenshot: only the pixels you intend should exist.
10-Minute Checklist
Run this once to confirm the watchlist works end-to-end, before you share a link.
| Check | How to verify | Pass condition | Fix if fails |
|---|---|---|---|
| Opens fast | Load on mobile | Under 3 seconds | Trim columns |
| Prices update | Refresh in 60s | Values change | Check data source |
| Symbols valid | Click each ticker | Real quote page | Fix tickers |
| Readable scan | View at 50% | Key info visible | Reorder fields |
| Shareable link | Open incognito | Same view loads | Fix permissions |
If any row fails, don’t add features. Fix reliability first.
Ship Your Watchlist Today, Then Improve It Weekly
Start with the smallest version that works: a clean sheet, a handful of tickers, and one dependable price source. Add only the notes and links you’ll actually use, then publish a public link after running a quick privacy check. Once it’s live, set a 10-minute weekly routine to prune dead ideas, update thesis notes, and keep the list useful instead of noisy.
Frequently Asked Questions
Are “open stocks” the same as a public stock watchlist?
Usually, yes—“open stocks” refers to a watchlist that anyone can view via a public link, while only you (or invited collaborators) can edit it.
Can I make my open stocks watchlist public without exposing my email or personal Google account details?
Yes. Publish or share a view-only link and avoid displaying the file owner name in the header when possible; for extra privacy, use a separate Google account dedicated to public documents.
How do I measure whether my open stocks watchlist is actually useful over time?
Track a simple hit rate (how often a watchlist name becomes a trade/investment) and review performance monthly using columns like “added date,” “thesis,” and “result vs benchmark (SPY/QQQ).”
How often should I refresh or clean up an open stocks watchlist?
Do a quick weekly pass to remove broken tickers and update notes, then do a deeper monthly review to prune names that no longer fit your criteria or have invalidated theses.
What can I use instead of Google Sheets to publish an open stocks watchlist?
A Notion database, Airtable, or a simple GitHub Pages table can work; most people pick based on how easily it supports view-only sharing, quick edits, and reliable price updates.
Upgrade Your Open Watchlist
An open stocks watchlist is easy to publish, but keeping it fresh with real leadership and market context takes consistent daily inputs.
Open Swing Trading helps you surface breakout leaders with daily RS rankings, breadth, and sector/theme rotation—then turn them into a 5–15 minute workflow. Get 7-day free access with no credit card.