Build sector rotation analysis in 15 minutes daily
A time-boxed guide to building a daily sector rotation workflow in 15 minutes—set a repeatable universe and template, pull prices fast, compute two-horizon relative strength, rank sectors with consistent scoring, and confirm signals with a simple breadth filter before publishing a rotation map.
Most sector rotation “signals” fail in practice because the process is inconsistent: different universes, shifting lookbacks, and rankings that change with every tweak. That’s how you end up chasing yesterday’s winners instead of tracking a real regime shift.
This guide gives you a 15-minute daily routine you can repeat without thinking. You’ll lock a sector setup, grab the right price data, calculate two-horizon relative strength, rank and bucket sectors consistently, run one breadth check, and finish with a clear rotation map you can act on.
Set your rotation setup
Your daily sector rotation session only works if the inputs stay stable. Otherwise, you’re ranking noise and calling it a “process.”
Build one repeatable setup: a fixed universe, two timeframes, and one scoring rule that always outputs a ranked list.
Pick sector universe
Pick a small, liquid universe so your rankings stay comparable day to day.
- Select 10–12 sector ETFs you can trade easily.
- Add one benchmark ETF, like SPY or VT.
- Confirm tight spreads and high average volume.
- Save tickers into a single reusable watchlist.
- Lock the list for 90 days.
If you keep changing the universe, your “rotation” is just selection bias.
Choose two horizons
Two windows catch different behaviors: fast rotation and slower trend. A simple default is “4 weeks” and “6 months,” like checking both a sprint and a marathon split.
When both horizons agree, you can size up without getting clever.
Define risk guardrails
Guardrails stop you from over-trading the leaderboard. Write them down so you don’t negotiate with yourself at 3:58pm.
- Cap any single position at 10–20%.
- Cap total sector exposure at 40–60%.
- Limit changes to one rebalance per week.
- Exit on benchmark-relative breakdown.
- Stop out at a defined ATR multiple.
Your edge dies the moment risk becomes discretionary.
Create a template
A one-page template keeps you fast and consistent.
- Add inputs: tickers, prices, returns, dates.
- Add ranks: short, intermediate, and combined score.
- Add notes: catalysts, earnings, macro events.
- Add decision fields: buy, hold, sell, size.
- Save as a daily duplicate file.
Once the template exists, the “15 minutes” becomes real.
Gather daily price data
You need just enough prices to compute returns and relative strength. Keep it boring: close-to-close data and one benchmark series.
- Pull today’s close for each sector ETF you track.
- Pull today’s close for your benchmark, like SPY or ACWI.
- Pull the last 21 closes for each sector and the benchmark.
- Compute 1D, 5D, and 21D returns from those closes.
- Store the results in one tidy table keyed by date and ticker.
If your inputs are consistent at the close, the rest of your rotation work becomes mechanical.
Calculate relative strength
You need a daily leaders-and-laggards view that is comparable across sectors. Relative strength does that by measuring each sector against the same benchmark, like “sector minus SPY.”
Compute two returns
Calculate both horizons so you catch fast moves and sustained trends.
- Choose lookbacks like 5D and 20D for every sector.
- Compute percent return for each sector: (Close/Close_n)-1.
- Compute the same percent returns for the benchmark.
- Align dates so every return uses the same trading day.
If your dates don’t line up, your rankings are fiction.
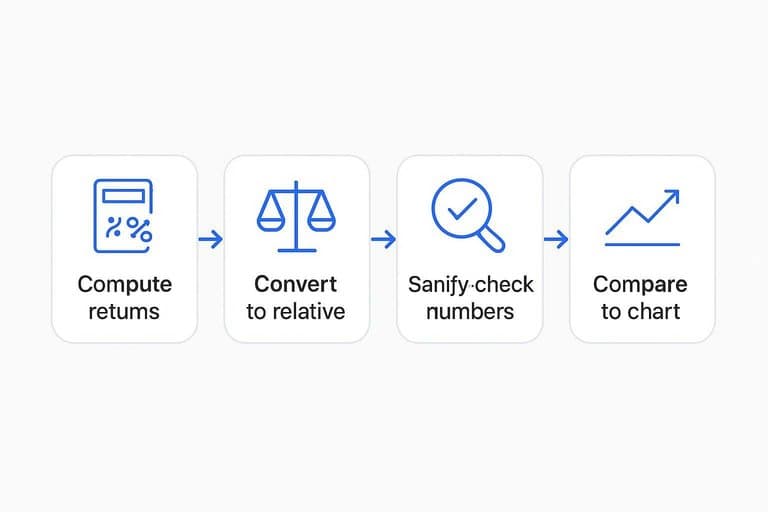
Convert to relative
Now convert raw returns into performance versus the benchmark.
- For each sector, subtract benchmark 5D return from sector 5D return.
- Store it as Rel_5D for that sector.
- Repeat for 20D and store as Rel_20D.
- Keep raw and relative columns side by side.
Raw return tells the story. Relative return tells you who’s winning.
Sanity-check numbers
Bad data looks like genius until it breaks your process. Do a quick pass for “+40% in a week” moves, missing closes, and corporate-action artifacts like splits.
Then compare the top three and bottom three sectors to a simple price chart. If the rank order feels wrong on sight, your inputs are wrong.
Rank sectors consistently
You already have relative-strength columns across horizons, but columns don’t make decisions. A single score does, like “Tech: +1.2, Utilities: -0.6,” updated every morning.
Your goal is a stable ranking that changes for real reasons, not because one horizon twitched.
Standardize scores
Different horizons live on different scales, so you normalize them first. Do it once per horizon, per day, across all sectors.
- Choose your horizons, like 1M and 3M relative strength.
- For each horizon, compute cross-sector z-scores or percentile ranks.
- Winsorize extremes, like cap at +/-2.5 z.
- Store standardized columns, like z_RS_1M and z_RS_3M.
If one horizon keeps dominating after this, your standardization is lying.
Weight and sum
You want one number per sector, every day, with the same recipe. Fixed weights beat “feel-based” weights when markets get loud.
- Pick weights that match your holding period, like 40% 1M and 60% 3M.
- Multiply each standardized horizon by its weight.
- Sum weighted horizons into a final score per sector.
- Rank sectors by score, highest to lowest.
Lock the weights for a quarter, or you’ll end up optimizing yesterday.
Create regime buckets
Ranks tell you who’s first, but regimes tell you what’s changing. Use two cutoffs: the score level and the score’s change versus yesterday or last week.
A clean model: Leading = high score and rising, Improving = low score but rising, Weakening = high score but falling, Lagging = low score and falling. Start with simple thresholds, like top/bottom 30% for score and +/-0.25 z for change.
Buckets are how you stop chasing #1 and start riding transitions.
Flag churn risk
Even good ranks can flip for dumb reasons, so you add noise alarms. These rules tell you when to downshift.
- Score gap to next rank is under 0.10 z
- Sector volatility is above its 60-day median
- Rank changes by 3+ spots in 5 days
- Score-change flips sign three days straight
When churn flags light up, act on buckets, not exact rank numbers.
Add one breadth check
You rotate best when the tape is healthy. One market-wide filter keeps you from “buying leaders” into a broad selloff.
Example: if the S&P is below its 200-day, you rotate slower. Or you don’t rotate at all.
Pick a market filter
You need one breadth gate that is easy to read daily. Pick one you will actually trust at 8:45am.
Choose one:
- Benchmark trend: SPY above 50/200-day
- A/D thrust: 10-day A/D ratio surge
- Volatility: VIX below a threshold
If you can’t explain it in one line, you won’t use it.
Define actions
Decide behavior before the market opens. Your filter should flip actions, not spark debates.
- If filter is risk-on, rotate into current leaders.
- If filter is risk-on, allow new adds and pyramid rules.
- If filter is neutral, hold leaders and stop new rotation.
- If filter is risk-off, cut exposure or shift defensive.
- If filter is risk-off, raise cash and tighten stops.
Pre-commitment beats “just this once” thinking.
Record today’s state
You prevent drift by writing it down. Two lines in your template is enough.
- Record today’s filter reading (value and timestamp).
- Mark state: risk-on, neutral, or risk-off.
- List allowed actions for today only.
- Note one forbidden action you’re tempted to take.
If it isn’t written, it isn’t a rule.
For a stable sector universe, reference the official Select Sector SPDR ETF lineup.
Produce today’s rotation map
You need one compact artifact you can reuse every morning. It should show leadership, laggards, and what you’ll actually do next.
Use this table format and fill it in from your relative strength and trend checks.
| Bucket | Sectors (ranked) | Why today | Next step |
|---|---|---|---|
| Top | XLK, XLF, XLI | RS up, above 20D | Add to hold list |
| Middle | XLY, XLE, XLC | Mixed RS, choppy | Wait for breakout |
| Bottom | XLU, XLRE, XLP | RS down, below 20D | Avoid new buys |
| Watchlist | XLB, XLV, XLE | Improving RS, base | Set alerts, define trigger |
If you can’t name a trigger, you’re not watching a trade, you’re watching a feeling.
Run the 15-Minute Rotation Routine Tomorrow Morning
- Open your template and confirm your sector universe, two horizons, and risk guardrails haven’t changed.
- Paste today’s closes (and prior reference dates) into the price tab; spot-check for missing ticks or obvious outliers.
- Compute short- and long-horizon returns, convert to relative vs your benchmark, and sanity-check that leaders/laggards make intuitive sense.
- Standardize scores, apply your fixed weights, assign regime buckets (Lead/Improve/Weaken/Lag), and flag churn risk when ranks are tightly clustered.
- Run your single breadth filter, record today’s state, and note the action rules it implies (risk-on, neutral, or defensive).
- Publish today’s rotation map table and log only the deltas: bucket changes, top-3 shifts, and any breadth flip—those are the decisions you’ll review later.
Frequently Asked Questions
Is sector rotation analysis the same as relative strength analysis?
Not exactly. Relative strength vs a benchmark is a core input, but sector rotation analysis also focuses on leadership changes over time and how to shift exposure as cycles and trends evolve.
Do I need intraday data to do sector rotation analysis effectively?
No—daily closes are usually enough for a reliable rotation process. Intraday data mainly helps if you’re trading very short timeframes or need tighter execution timing.
How do I measure whether my sector rotation analysis is actually improving results?
Track out-of-sample performance versus a simple benchmark (e.g., SPY) and a static sector mix, using metrics like CAGR, max drawdown, and Sharpe over at least 6–12 months. Also log turnover and transaction costs to confirm the edge survives real-world friction.
What are the best sector ETFs to use for sector rotation analysis in 2026?
Most investors use liquid, low-spread sector ETFs like the Select Sector SPDRs (XLF, XLK, XLE, etc.) or Vanguard sector ETFs. Pick one consistent family and stick with it to avoid mixing methodologies and liquidity profiles.
How often should I rebalance when using sector rotation analysis—daily, weekly, or monthly?
Most strategies rebalance weekly or monthly to reduce whipsaws and costs while still capturing leadership shifts. Daily analysis can guide your watchlist and timing, but daily rebalancing often increases turnover without improving net returns.
Turn Rotation Into Watchlists
Doing sector rotation analysis daily is simple on paper, but keeping the data, rankings, and breadth checks consistent is where most traders lose time.
Open Swing Trading updates daily RS rankings, sector/theme strength, and breadth so you can map rotation fast and build a focused watchlist in 5–15 minutes—get 7-day free access with no card.