Dow Gold Ratio: Master the dow gold ratio for smarter market timing
Explore how the dow gold ratio reveals long-term market cycles and boosts timing, risk control, and swing trading success.
Ever wondered how many ounces of gold it would take to buy the Dow Jones Industrial Average? That simple question is the key to understanding a powerful financial barometer: the Dow/Gold ratio.
A high or rising ratio tells us that stocks are beating gold, signaling strong investor confidence. But when the ratio is low or falling, it means gold is the stronger asset—a clear sign of widespread economic fear and uncertainty. For a swing trader, this isn't just an interesting metric; it's an actionable signal that can help you catch bigger trends and avoid major downturns.
What Is the Dow Gold Ratio and Why It Matters Now
If you could boil down all the market’s tangled emotions—greed, fear, optimism, and panic—into one clear number, this would be it. The Dow/Gold Ratio is far more than just a simple comparison between stocks and a commodity. Think of it as a gauge of market sentiment and where big money is flowing.
To calculate it, you just divide the point value of the Dow by the price of one ounce of gold. The result gives you a crystal-clear picture of which asset class is winning the tug-of-war for investor capital. Looking back through history, this ratio reveals distinct cycles, showing when financial assets (like stocks) are in favor over hard assets (like gold), and when the tables have turned. For a discretionary trader, grasping this dynamic is crucial for aligning your strategy with the market's prevailing mood.
Decoding Market Sentiment
The direction of the ratio gives you immediate, valuable clues about the current market environment. Here in 2026, keeping an eye on these shifts is more critical than ever for staying on the right side of major trends.
This single metric helps traders see the forest for the trees:
- A Rising Ratio: This points to a "risk-on" environment. Capital is flowing into stocks, which suggests economic optimism and a healthy appetite for growth. For a swing trader, this is a green light to hunt for momentum leaders and breakout plays.
- A Falling Ratio: This signals a "risk-off" mood. Investors are flocking to the perceived safety of gold, typically driven by fears of inflation, geopolitical trouble, or a looming recession. This is your caution flag to tighten stops, scale back position sizes, and prioritize protecting your capital.
The beauty of the Dow/Gold ratio is its elegant simplicity. It cuts right through the daily noise of news headlines and earnings reports to reveal the underlying tide of institutional capital. It tells you whether the market is fundamentally built on a foundation of confidence or fear.
This is a great moment to summarize these two distinct market regimes. The table below breaks down what each trend in the ratio means and how it typically plays out in the broader market.
Interpreting the Dow Gold Ratio's Market Signals
| Ratio Trend | What It Signals | Dominant Asset Class | Typical Market Environment |
|---|---|---|---|
| Rising | "Risk-On" | Stocks & Financial Assets | Economic expansion, investor optimism, high appetite for growth and speculation. |
| Falling | "Risk-Off" | Gold & Hard Assets | Economic uncertainty, fear of inflation or recession, flight to safety and capital preservation. |
As you can see, the ratio provides a simple but effective framework for understanding the big picture. It’s not about predicting next week's price action, but about understanding the environment you're trading in.
A Practical Tool for Swing Traders
For active swing traders, especially those using a flexible framework like OpenSwingTrading, this macro context is pure gold. Instead of trying to guess the market's next major move, the ratio provides a solid foundation for your decisions.
No, it won't predict every daily swing, but it acts like a powerful tailwind. Knowing the dominant trend helps you build higher-probability watchlists and deploy capital more intelligently, making sure your trades are swimming with the current, not against it. This kind of alignment is a core advantage of open swing trading, helping you catch bigger moves by positioning yourself with the prevailing flow of money.
A Century of Market Cycles Told by One Ratio
They say history doesn’t repeat, but it often rhymes. If that's true, then the Dow/Gold ratio is the market’s poet laureate. This one number tells a century-long story of epic booms and busts, showing how extreme valuations in stocks eventually give way to hard assets, and back again.
By studying its long-term peaks and troughs, we can see a clear, almost generational pattern. These aren’t just dusty historical facts; they're powerful case studies in market psychology and capital flows. For a swing trader, understanding this rhythm helps you know when to be aggressive and when to play defense.
The Great Peaks and Troughs
The Dow/Gold ratio moves in massive, multi-decade waves. When it reaches an extreme—either way up or way down—it has consistently signaled a major shift in market leadership and investor sentiment.
This timeline gives you a bird's-eye view of these major turning points, where capital began flowing out of one asset and into the other.
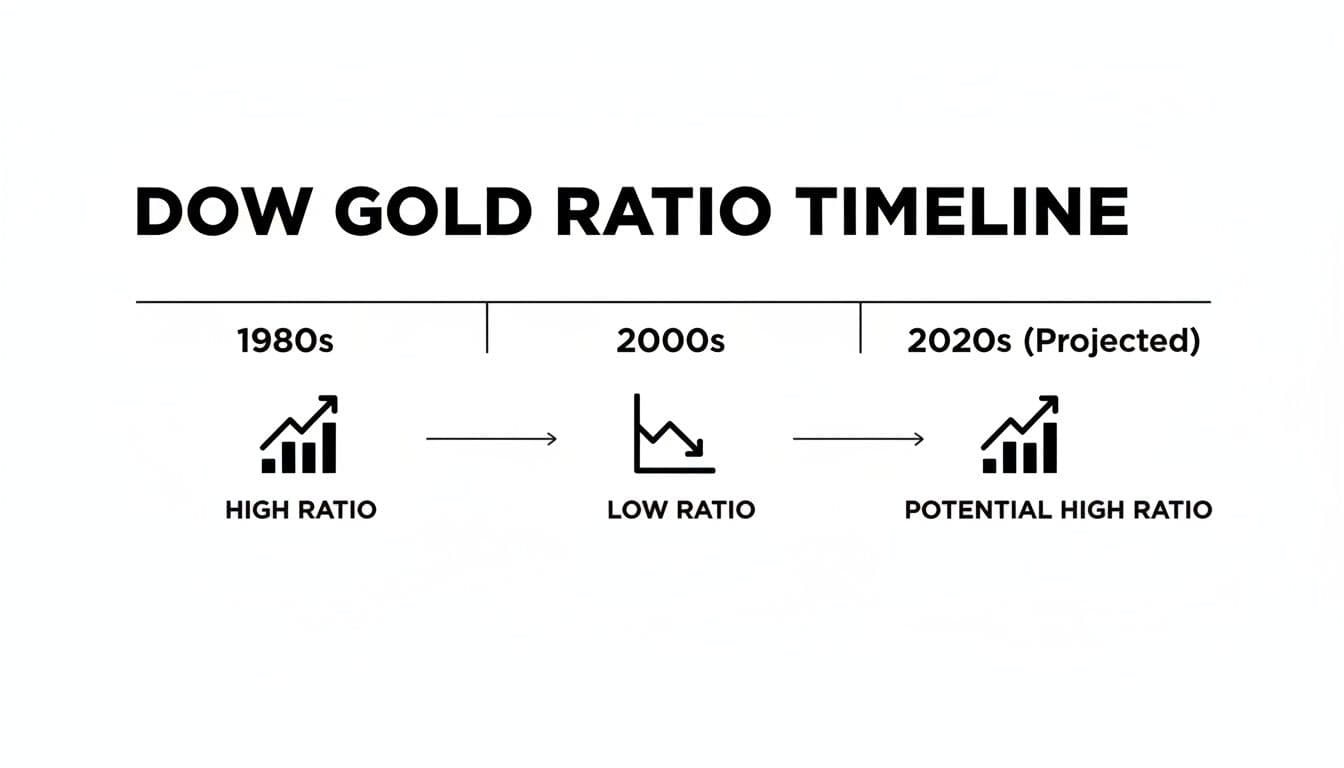
As you can see, these peaks and valleys aren't random noise. They mark the end of one long-term market regime and the beginning of another.
Take the post-war boom, for example. In February 1966, the ratio rocketed to a peak of 29. This was a screaming signal that stocks were at their most overvalued relative to gold in modern history. What happened next? A painful, 15-year grind where the ratio collapsed over 88%, hitting a low near 1 in January 1980.
During that same stretch, the U.S. ditched the gold standard in 1971. Gold, unshackled from its 35** peg, went on an absolute tear, soaring to **850 by 1980—a mind-boggling 2,329% gain. Meanwhile, the Dow went virtually nowhere. You can dig into more historical insights on these dramatic capital shifts to see just how predictive these peaks can be.
And it wasn't a one-off event. The same pattern showed up again, with startling precision, at the turn of the millennium.
The Dot-Com Bubble Echo
Remember the tech mania of the late 1990s? Stock valuations were pushed to euphoric levels not seen since the Roaring Twenties. By 1999, the Dow/Gold ratio shot past 40 to an all-time high. It was an undeniable warning that the relationship between paper assets and hard assets had stretched to a breaking point.
For anyone watching the ratio, what came next was no surprise:
- The Stock Market Imploded: The NASDAQ cratered by nearly 80%, pulling the rest of the market down into a brutal bear market.
- A New Gold Bull Was Born: Gold, which had been in the doghouse for two decades, bottomed out and started a monster bull run. It climbed from under 300** to over **1,900 an ounce over the next decade.
Once again, the peak in the ratio perfectly marked the time to switch from a risk-on, stock-focused strategy to a defensive, capital-preservation mindset. The signal was crystal clear: the party in stocks was over, and a new era favoring hard assets was dawning.
For swing traders, these historical cycles are an invaluable strategic map. They show that when the ratio hits an extreme, the dominant market trend is likely living on borrowed time. This isn't a signal for day trading, but a macro tailwind that can guide your strategy for months and even years.
Understanding this history is the foundation for using the Dow/Gold Ratio effectively today, in 2026 and beyond. By recognizing where we are in the current long-term cycle, traders can better position themselves for what's likely coming next.
This big-picture context is a core advantage of our OpenSwingTrading approach—it forces you to look beyond daily chart noise and align with the massive capital flows that truly move the market. The ratio helps you decide whether you should be hunting for aggressive breakouts or seeking shelter in defensive names, making sure your strategy is in sync with the prevailing economic tide.
How the Ratio Reveals the Market's True Strength
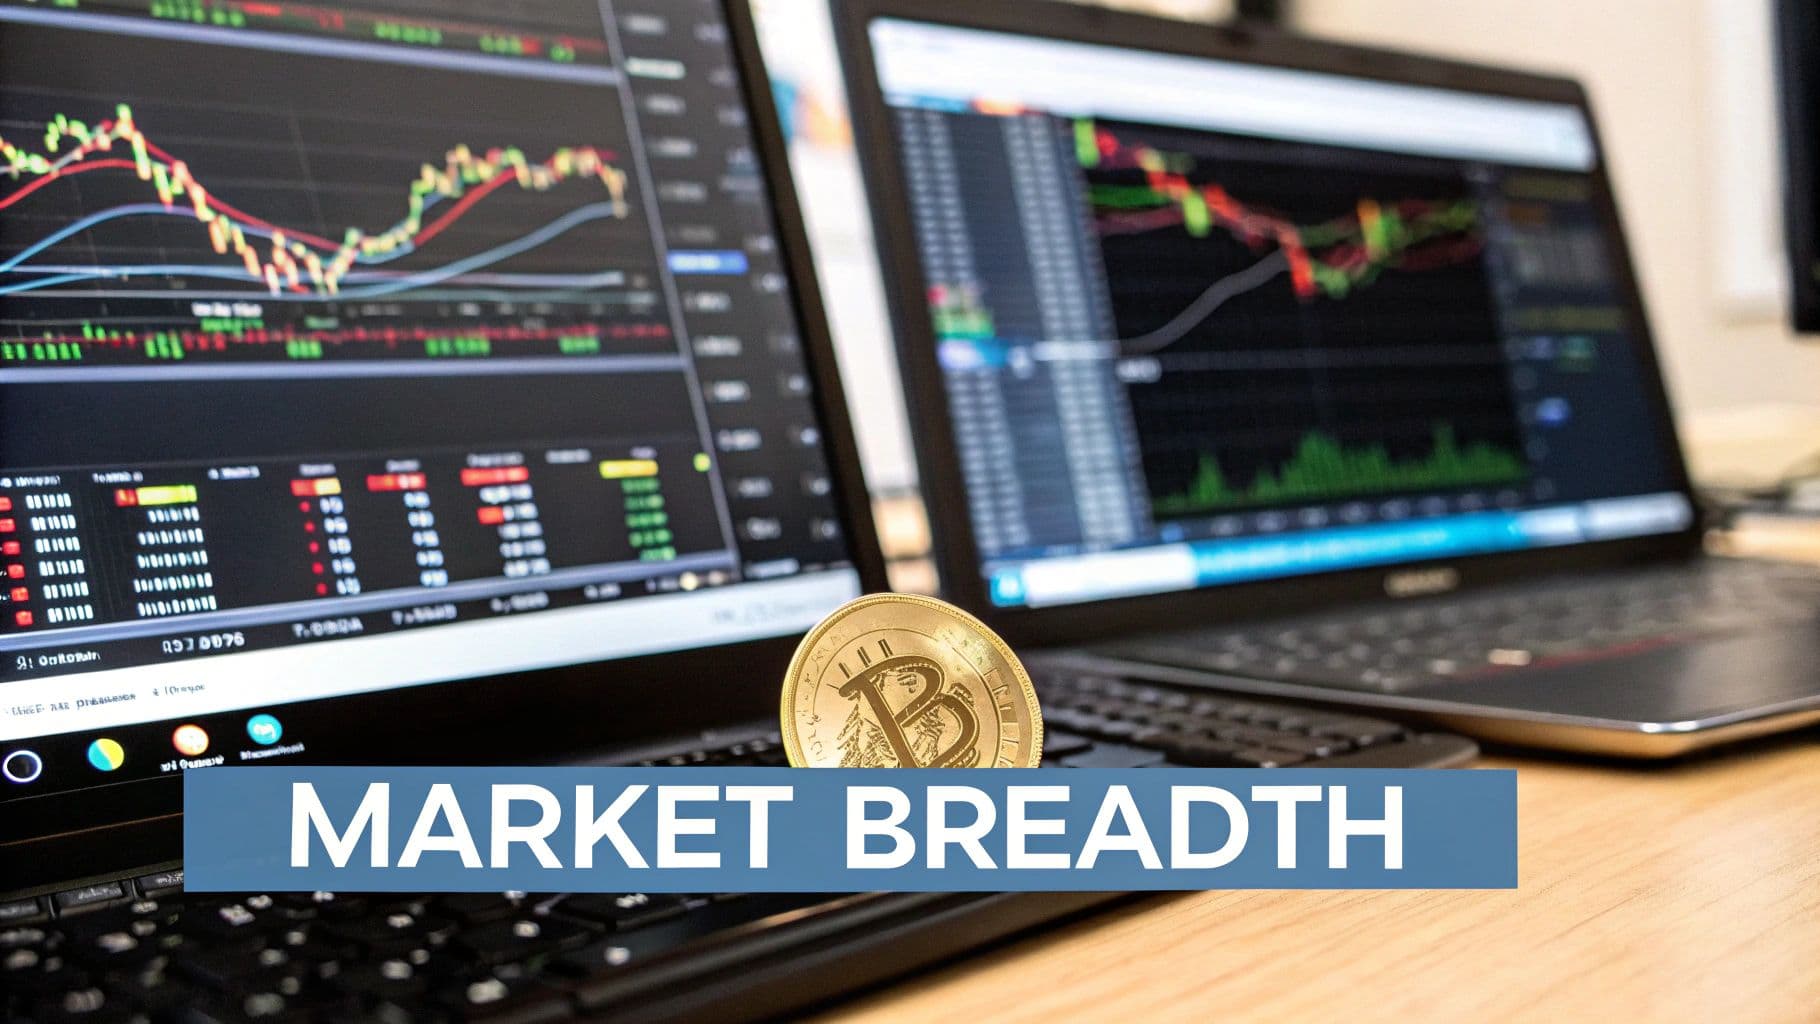
The Dow/Gold ratio is much more than just a scoreboard for stocks versus gold. Think of it as an x-ray for the stock market's internal health. It helps us see past the headline numbers of the S&P 500 or Nasdaq and get a real feel for market breadth—whether a rally has broad support or is just being propped up by a handful of giants.
When the ratio is in a solid uptrend, it's a great sign. It tells you the bull market is healthy and has legs. This means money isn't just flooding into a few mega-cap stocks; it’s spreading out across many different sectors and companies. The whole army is advancing, not just a few elite special forces units.
On the flip side, a falling ratio often signals that the market is rotting from the inside out. Even if the major indexes are grinding out new highs, a deteriorating Dow/Gold ratio is a warning. It suggests leadership is narrowing as capital quietly slips away into the safety of hard assets and defensive sectors. That's a classic footprint of cautious institutional money.
A Powerful Filter for Sector Strength
For a discretionary swing trader, this is where the rubber meets the road. You can use the Dow/Gold ratio's trend as a top-down filter to gut-check your trading ideas, particularly when picking which sectors to focus on. It helps you see the difference between a real, conviction-driven trend and a fleeting, head-fake rotation.
Let's say tech stocks are on a tear. A quick glance at the ratio adds a crucial layer of context.
- Rising Ratio: If the Dow/Gold ratio is also climbing, it confirms a broad, risk-on appetite across the market. This gives you a green light, suggesting the tech rally is fueled by real confidence. You can trade those tech breakouts with much more conviction.
- Falling Ratio: But if the ratio is heading south while tech is hot, that's a red flag. It could mean the tech rally is more of a "flight to quality" within stocks, not a sign of a truly strong market. Tech might just be the last bastion of hope before a wider downturn.
This simple check bridges the gap between a high-level market view and your day-to-day trading. The goal is to make sure you’re fishing in the right ponds—positioning yourself in sectors that not only have momentum but are also riding the market's dominant capital wave.
The Dow/Gold Ratio acts as your market health validator. It answers the critical question every swing trader should ask: "Is the rally I'm seeing in my target sector a sign of genuine market strength, or is it just the last gasp of a tired bull?"
Making It Actionable in Your OpenSwingTrading Workflow
Bringing this into your daily routine using a platform like OpenSwingTrading is simple. Especially now, in 2026, when market sentiment can turn on a dime, this kind of macro check-in gives you a real strategic edge. You’re aligning your individual trades with the market's underlying character.
Imagine the OpenSwingTrading platform flags the energy sector as a top performer based on its relative strength scores. Before you even start building a watchlist, you can use the Dow/Gold ratio as a final confirmation filter.
- Check the Ratio's Trend: Is it rising, falling, or chopping sideways?
- Confirm the Narrative: A rising ratio gives you a macro tailwind for aggressive trades in cyclical sectors like energy, as it points to broad economic optimism.
- Refine Your Watchlist: With that confirmation in hand, you can build your watchlist with confidence. You can focus on the strongest energy stocks the platform has identified, knowing you're swimming with the current, not against it.
This quick step helps you avoid one of the biggest trading sins: chasing hot sectors in a deteriorating market. That's a surefire way to bleed capital. Instead, you can focus your time and risk on setups that have both strong technicals and a supportive macro environment—a core principle of open swing trading.
Putting the Dow Gold Ratio to Work in Your Trading

Knowing the story behind the Dow/Gold ratio is one thing. Actually using it to make better trades is a whole different ballgame. This is where we bridge the gap between theory and your bottom line.
By weaving the ratio’s signals into your daily process, you can build a more resilient trading workflow. The goal isn’t to replace your instincts or your existing system. It’s about layering this powerful macro context on top, giving you an extra edge that keeps your trades aligned with the market's bigger mood.
Think of it as creating a series of simple "if-then" rules that sharpen your focus, tighten your risk management, and improve your stock selection. For a swing trader, especially one who relies on a data-driven approach like we teach at OpenSwingTrading, this adds a crucial layer of confirmation. You’ll find yourself not just picking strong stocks, but picking them at the right time.
Setting Your Strategic Compass
The first step is using the ratio to set your strategic bias for the coming weeks and months. Is it time to be aggressive and hunt for breakouts, or is it time to play defense and protect your capital? The dow gold ratio’s direction gives you the answer.
Here in 2026, market sentiment can turn on a dime. Having a macro filter like this helps you adjust your mindset before the rest of the crowd catches on, which is a massive advantage in swing trading.
- When the Ratio is Rising: This is your green light for a risk-on environment. Your bias should be aggressively long. You can feel more confident increasing position sizes on your best ideas and letting your winners run a little further.
- When the Ratio is Falling: This is a clear warning sign of a risk-off mood. Your priority immediately shifts to capital preservation. That means smaller position sizes, tighter stop-losses, and being extremely selective about any new long trades.
This simple check acts as a compass, pointing you in the right direction before you even glance at a single stock chart.
Using "If-Then" Logic to Build Smarter Watchlists
Once you have your strategic bias, you can use the ratio to build smarter, more focused watchlists. Instead of getting distracted by every shiny new object, you can filter your universe of stocks to fit the market's personality. This alone will dramatically improve the quality of your trade setups.
Let's look at some real-world "if-then" thinking:
IF the Dow/Gold ratio is climbing steadily, THEN I'm going to load up my primary watchlist with high-beta, economically sensitive names. I'll be digging through sectors like technology, consumer discretionary, and industrials, and then using the OpenSwingTrading platform to pinpoint the top-ranked leaders within those groups.
IF the Dow/Gold ratio is rolling over from a peak or already in a downtrend, THEN my focus flips to defense. My watchlist will be filled with names from utilities, consumer staples, and healthcare. I'm also going to start screening precious metals miners and gold ETFs, looking for leaders in the flight to safety.
This methodical process keeps you from fighting the market. It ensures the stocks you’re stalking have a powerful macro tailwind at their back. The best trades often feel easy for a reason—they're flowing with the dominant current.
A Practical Table for Trading Plays
To make this even more concrete, the table below outlines specific trading plans based on different signals from the dow gold ratio. Use these 'if-then' scenarios to align your swing trading strategy with the macro environment signaled by the ratio.
Practical Trading Plays Based on the Dow Gold Ratio
| Ratio Signal | Market Condition Implied | Your Actionable Trading Plan |
|---|---|---|
| High & Losing Momentum (>20) | Late-stage bull market, growing risk of a major 'risk-off' shift. | Trim position sizes on new breakouts. Move stop-losses up to protect profits. Start scanning defensive sectors and gold miners for relative strength. |
| Low & Forming a Base (<5) | Potential generational buying opportunity in stocks, early 'risk-on' shift. | Start building aggressive watchlists of top-ranked growth stocks. Get ready to deploy more capital into confirmed market leaders. |
| In a Confirmed Uptrend | Healthy bull market with strong investor confidence. | Focus on momentum and breakout setups. Trust relative strength rankings to find the strongest stocks in the strongest sectors. |
| In a Confirmed Downtrend | Bear market or major correction with high investor fear. | Make capital preservation your #1 job. Look for short-term trades in assets bucking the trend, like inverse ETFs or gold-related stocks. |
By building this logic into your pre-market routine, the Dow/Gold ratio stops being an interesting historical chart and becomes a dynamic tool that directly sharpens your trading decisions today.
Know Its Limits, Avoid the Traps
Every powerful tool comes with a user manual, and the Dow/Gold ratio is no different. The key to using it effectively is knowing what it can't do. If you treat it like a magic crystal ball for calling daily market moves, you're setting yourself up for frustration and costly mistakes.
The biggest trap traders fall into is thinking the ratio is a precise timing indicator. It's not. Seeing a high reading doesn't mean you should go out and short the market tomorrow. Likewise, a rock-bottom reading isn't a signal to blindly pile into stocks. This ratio moves in massive, multi-year waves, making it a terrible signal for short-term entries and exits.
Its real value is in identifying the big-picture market regime. It tells you whether the prevailing winds favor risk-on assets like stocks or defensive plays like gold. For a swing trader, that’s incredibly valuable context, but it’s not a trade trigger.
This Is Not a Standalone Signal
Another rookie mistake is using the dow gold ratio all by itself. No single indicator can ever tell you the whole story of the market. Relying only on this ratio would be like trying to navigate a ship with just a barometer—you might know a storm is brewing, but you have no clue where you are or what's directly in your path.
Think of the ratio as the long-range weather forecast for your trading. It tells you whether to pack for sunshine or prepare for a storm. Your charts, volume, and relative strength data—the tools you use on a platform like OpenSwingTrading—are your GPS, guiding your every turn on the ground.
The ratio helps explain the "why" behind major market trends, while your technical analysis tells you the "when" and "where" for each specific trade. They’re meant to work together, one complementing the other.
Understanding Its Built-in Bias
You also have to recognize the ratio's built-in limitations. The Dow Jones Industrial Average is just 30 large-cap, "blue-chip" companies. While they are giants, they aren't the entire stock market. They don't represent the thousands of small and mid-cap growth stocks that often drive the most exciting trends.
This means the picture the ratio paints can be a little skewed. Here are a few things to always keep in the back of your mind:
- Large-Cap Focus: Its signal is heavily influenced by the fate of massive, established corporations.
- Sector Concentration: The Dow has a different sector makeup than broader indexes. It's less tech-heavy than the S&P 500 or Nasdaq, which can affect its performance.
- Price-Weighted Quirks: Unlike the S&P 500, which is weighted by market cap, the Dow gives more influence to stocks with higher share prices, regardless of the company's overall size.
For these reasons, it's smart to use the ratio as a broad sentiment gauge and then check its signal against what indexes like the S&P 500 are doing. Some traders even create their own "S&P 500/Gold Ratio" to get a more complete view.
By respecting these limitations, you can use the ratio intelligently. Especially now, in 2026, having this balanced perspective is critical. It helps ensure the dow gold ratio serves as a valuable strategic guide in your open swing trading toolkit, keeping you on the right side of the market's underlying character.
Building Your All-Weather Trading Strategy
By now, you’ve seen how the Dow/Gold ratio can act as a reliable market compass. It cuts through the day-to-day noise, revealing the deep, underlying currents of where big money is flowing. The final step is translating that high-level insight into a durable, all-weather trading process that actually works for you here in 2026.
The goal isn't just to have another indicator; it's to build a flexible framework that adapts to the market's ever-changing personality. When you combine the ratio's macro clarity with a data-driven tool like the OpenSwingTrading platform, you stop guessing and start trading in sync with the dominant trend. It’s a powerful combination that lets you trade with conviction, whether the market is roaring ahead or grinding through a defensive, risk-off phase.
A Cohesive Framework for Any Market
A truly effective strategy is built on a simple, repeatable process. The first step is always the same: use the Dow/Gold ratio to get a read on the market's overall character. Is the ratio trending higher, signaling a "risk-on" appetite? Or is it falling, pointing to a "risk-off" flight to safety?
This single assessment sets the stage for everything that follows. It shapes your bias, dictates your level of aggression, and even tells you what kinds of setups are worth your time. Think of it as the ultimate top-down filter that brings immediate focus to your trading.
Once you know the macro environment you're operating in, you can drill down with a platform like OpenSwingTrading to execute with precision. The platform’s relative strength rankings will pinpoint the specific sectors, industries, and stocks leading the charge in the current regime.
By layering the big-picture clarity of the Dow Gold Ratio onto precise, data-driven stock analysis, you can navigate any market environment with greater confidence. This is the essence of a truly adaptable, open swing trading approach—it ensures you are always positioned on the right side of major market trends.
Adapting Your Exposure and Stock Selection
So, how does this all come together in your actual trading? This integrated approach directly impacts your practical decisions—not just what you buy, but how you buy it and how much risk you take on.
Here’s what it looks like in the real world:
- When the Ratio Signals Risk-On: This is your green light. You can confidently increase your position sizes in the top-ranked growth stocks that the platform uncovers. You might give your winning trades more room to run, knowing you have a powerful macro tailwind at your back.
- When the Ratio Signals Risk-Off: Your priority immediately shifts to capital preservation. This means reducing position sizes, tightening stop-losses, and focusing your watchlist on defensive sectors or gold-related equities that the platform shows are outperforming the broader market.
This dynamic adjustment is what keeps you from getting too greedy at market tops or too fearful at major bottoms. It's a systematic way to manage risk and stay aligned with what institutional capital is doing. Ultimately, this framework gives you an adaptable edge, allowing you to find opportunity and protect your capital no matter which way the market winds are blowing.
Common Questions Answered
Let's tackle some of the most common questions traders have when they first start incorporating the Dow/Gold ratio into their workflow. Here are some quick, practical answers to get you started.
Does a Low Ratio Mean I Should Buy Stocks Right Now?
Not so fast. A low Dow/Gold ratio is a fantastic sign that stocks are historically cheap compared to gold. It often signals that a major long-term buying opportunity is brewing, but it's absolutely not a precise timing tool for your entries.
Market bottoms are a process, not a single price point on a chart. As a swing trader, you should view a low ratio as your signal to start hunting for confirming evidence. Start looking for signs that a new uptrend is taking hold—things like improving market breadth and new leadership popping up in cyclical sectors. Use your tools to find the strongest stocks as the market turn solidifies.
How Often Should I Be Checking This Ratio?
The beauty of the Dow/Gold ratio is that it’s a slow-moving, big-picture indicator. You don't need to—and shouldn't—check it every day. This is a huge plus for swing traders trying to tune out the daily noise.
A quick glance at the ratio on a weekly or monthly basis is more than enough. That rhythm is perfect for keeping your strategic perspective during your regular market review. The idea is to simply be aware of the current regime and its general direction, which helps frame your strategy for the coming weeks without getting bogged down by minor wiggles.
The ratio's real power is in its infrequent, high-level signals. Watching it too closely will just tempt you to overreact to tiny moves, which completely defeats its purpose as a long-term guide.
Can I Use the S&P 500 Instead of the Dow?
Absolutely. In fact, creating an "S&P 500/Gold Ratio" is a great idea. It gives you a broader and more modern look at the market's health since the S&P 500 is a much better representation of the U.S. economy today. The only reason the Dow is used so often is its incredible, century-long history, which is perfect for studying those massive, multi-decade cycles.
For your day-to-day swing trading, both ratios will move in the same general direction and give you very similar signals about the prevailing risk-on or risk-off environment. The core concept of tracking these major capital flows works just as well, no matter which index you anchor to gold.
Ready to stop guessing and start aligning your trades with the market's real strength? OpenSwingTrading gives you the data-driven clarity you need to find high-performance leaders and trade with the dominant trend. Start your free trial at OpenSwingTrading.com and see the difference a systematic approach can make.