Dow to Gold Ratio: Master the Metric for Market Insight - dow to gold ratio
Discover what the dow to gold ratio says about market sentiment and how to use it to refine swing trading decisions.
At its core, the Dow to Gold ratio is a simple but powerful measure. It tells you exactly how many ounces of gold it would take to "buy" the entire Dow Jones Industrial Average. Think of it as a market-wide tug-of-war between optimism and fear.
A high ratio means stocks are winning, reflecting investor confidence. A low ratio means gold is pulling harder, signaling a flight to safety.
What the Dow to Gold Ratio Reveals About the Market
Picture a giant seesaw balancing investor sentiment. On one end, you have stocks (represented by the Dow Jones Industrial Average), which get a lift from economic growth and general optimism. On the other end, you have gold, the classic safe haven that investors flock to when they're worried about uncertainty. The Dow to Gold ratio is simply the real-time measurement of which end of that seesaw is higher.
The math couldn't be easier: you just divide the Dow's current price by the spot price of one ounce of gold. But the number you get is far from abstract—it's a direct gauge of where the market's conviction lies at any given moment.
Interpreting High and Low Ratios
When the ratio is high—say, 20 or more—it's a clear signal that stocks are the dominant force. This usually happens during strong economic expansions with low inflation, when everyone feels good about the future. For a swing trader, this is a major green light. It suggests the wind is at your back for bullish, momentum-driven trades in the stock market. An actionable insight for an open swing trader is to use this environment to increase position sizes on high-conviction trades and hunt for breakouts in leading sectors.
On the other hand, a low ratio—especially one dropping below 10 or even nearing 1—tells a very different story. It means gold is outmuscling stocks. This is the classic signature of a recession, a period of high inflation, or some geopolitical crisis that has investors running for cover. A falling ratio is a massive warning flare for traders to get defensive, tighten up their risk management, and shift their focus from making profits to preserving capital.
As we navigate the markets in 2026, getting a handle on this dynamic is crucial. The ratio cuts through the daily noise to give you a clean, high-level view of where big money is flowing, helping you align your strategy with the market's true mood.
This ratio isn't a direct buy or sell signal for an open swing trader. Think of it more as a foundational "weather report" for the market. It answers the first big question you should always ask: "Are we in a 'risk-on' or 'risk-off' world right now?"
Knowing the answer gives you a huge advantage. It frames your entire approach, from which sectors you look at to how much capital you put on the line, before you even pull up a single chart. This kind of macro awareness helps ensure you're swimming with the market's current, not fighting against it—a core benefit of a disciplined swing trading approach.
Interpreting Dow to Gold Ratio Signals
Here's a quick cheat sheet to help you translate the ratio's signals into actionable market context. Think of it as a decoder for market sentiment.
| Ratio Level | What It Signals | Dominant Market Psychology | Potential Swing Trading Focus |
|---|---|---|---|
| High (e.g., 20+) | Stocks are heavily favored over gold. | Risk-On: High confidence, optimism, appetite for growth. | Aggressive long positions in high-beta stocks, growth sectors, and market leaders. |
| Moderate (e.g., 10-20) | A balanced or transitional market. | Neutral to Cautious: Investors are weighing growth against potential risks. | Selective stock picking, both long and short. Focus on relative strength. |
| Low (e.g., <10) | Gold is outperforming or on par with stocks. | Risk-Off: Fear, uncertainty, focus on capital preservation. | Defensive posturing, focus on safe-haven assets, consider shorts on weak stocks. |
| Extreme Low (e.g., <5) | A crisis or deep recessionary environment. | Extreme Fear/Capitulation: Investors have abandoned risk assets. | Capital preservation is paramount. Look for generational buying opportunities in stocks. |
This table helps you quickly align your trading mindset with the underlying economic climate, ensuring your strategy is in sync with the bigger picture.
Learning from Historical Market Cycles
To really get a feel for what the Dow to Gold ratio can do, you have to look back at its history. This isn't just an academic exercise; it's like studying a map of market psychology, showing the massive shifts between investor euphoria and deep-seated fear.
For a swing trader, looking at these historical cycles isn't about trying to predict the future with pinpoint accuracy. It's about building an intuition—a gut feeling—for when the market is getting dangerously lopsided. This context is everything when it comes to managing risk and knowing when to adjust your game plan.
Think of the ratio as a pendulum swinging between two extremes: moments when stocks are the undisputed kings and times when gold is the only safe harbor investors want.
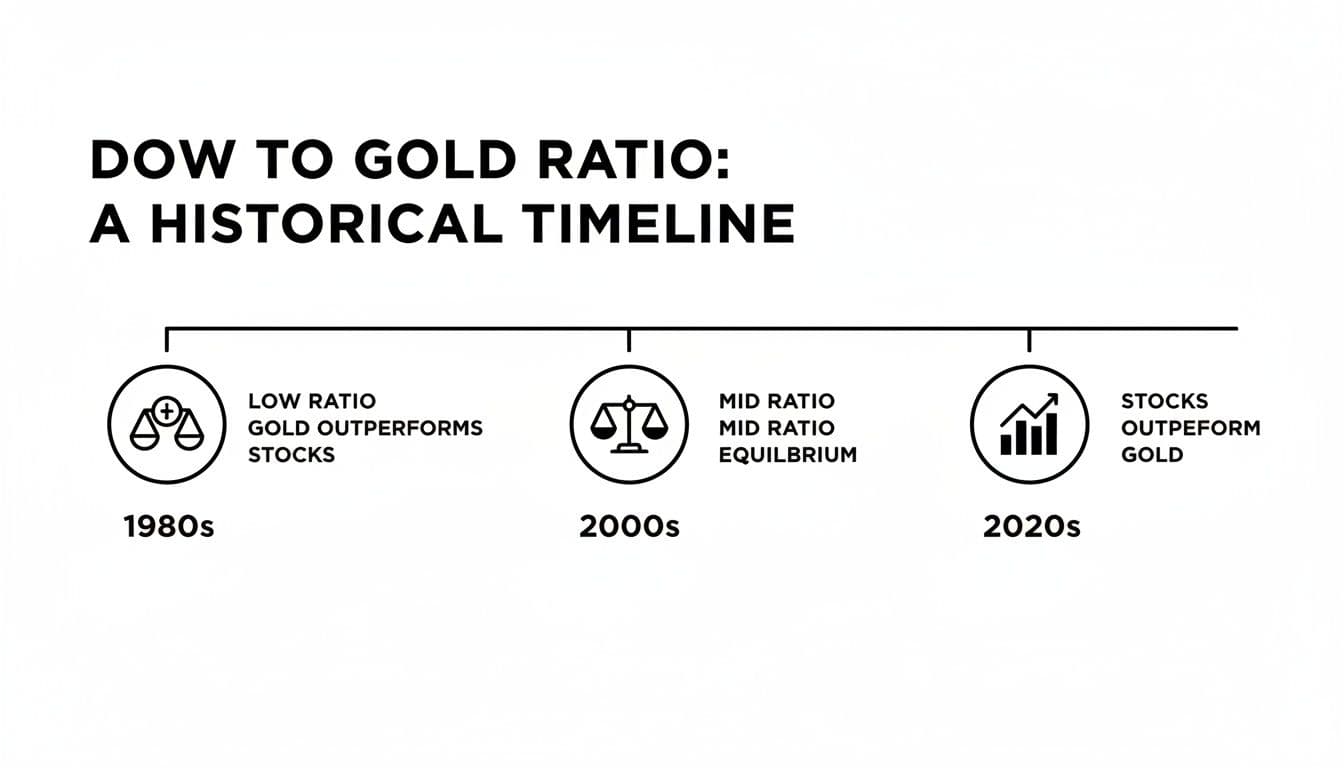
This visual timeline isn't just a chart; it’s a story of how investor confidence and fear have driven markets in and out of balance for decades.
The Dot-Com Peak: A Story of Extreme Optimism
The late 1990s were a wild time, and they offer a perfect case study in market mania. The Dow to Gold ratio screamed to its all-time high of 42.19 in August 1999, right at the peak of the dot-com bubble. That number meant it took over 42 ounces of gold to "buy" the Dow.
At that moment, the Dow Jones was charging toward 12,000, and tech stocks were the talk of the town. Meanwhile, gold was completely forgotten, collecting dust near $252 an ounce. This peak was the grand finale of a massive bull market in stocks that had been running since the early 1980s.
What happened next? The ratio utterly collapsed. It fell over 85% to a reading of just 6 by August 2011, as investors who had been burned by stocks fled back to the safety of gold after the 2008 financial crisis. You can explore a deeper analysis of these market shifts to see the full picture.
For a trader in 2026, the key lesson from 1999 is clear: when everyone is piling into one asset class and completely ignoring its safe-haven alternative, it's a giant red flag for complacency. The ratio gives you an objective number to measure that sentiment.
The 1980 Low: A Flight to Safety
Now let's rewind to the opposite extreme: 1980. This was a period of intense economic fear. Stagflation was crippling the economy, geopolitical tensions were high, and investors wanted out of stocks. They piled into gold as a last resort.
This panic drove the Dow to Gold ratio all the way down to a near 1-to-1 reading. That’s right, one ounce of gold could nearly buy the entire Dow Jones Industrial Average.
That historical low marked a generational buying opportunity for anyone brave enough to step into the stock market. But you had to see past the overwhelming panic. It shows the other side of the coin: when fear gets so extreme, it creates incredible value for disciplined, contrarian traders.
Studying these dramatic swings reveals a few recurring patterns:
- Long-Term Trends: The ratio moves in long, sweeping arcs that last for years, sometimes even decades. It doesn't just flip-flop randomly.
- The Extremes Signal Reversals: Historically, readings above 30 (euphoria) or below 2 (fear) have often marked major market turning points.
- Actionable Context for Traders: A rising ratio is a tailwind for an aggressive, pro-equity stance. A falling ratio is a warning shot, demanding a defensive posture, tighter risk controls, and a focus on just preserving your capital.
By understanding how the market has behaved at these historical peaks and valleys, we can get a much better sense of where we might be in the current cycle. This turns dry historical data into a practical, powerful tool for making smarter trading decisions today.
Putting the Ratio to Work in Your Trading Strategy
Understanding the big picture is great, but the real test is how you use that knowledge in the heat of the moment. The Dow-to-Gold ratio isn't some magic indicator that spits out perfect buy or sell signals. Think of it more like a macro weather report. It won't tell you if it's going to rain on your specific street corner, but it will tell you if there's a hurricane forming offshore.
For a swing trader, this is invaluable. It helps you set your overall bias. Are we in a risk-on environment where it pays to be aggressive? Or is it time to batten down the hatches and play defense? This high-level context should be the foundation of your trading plan.
When you use it this way, the ratio stops being a historical curiosity and becomes a practical tool. It helps you align your trades with the major tides of capital flow, putting the odds in your favor before you even place a trade. This proactive alignment is a key benefit of open swing trading: you're not just reacting, you're anticipating.
Setting Your Directional Bias
The trend of the Dow-to-Gold ratio tells a simple story: are stocks or hard assets winning the tug-of-war for investors' money? Here’s a straightforward way to read the signals:
- A Rising Ratio Trend: If the ratio is climbing, making higher highs and higher lows, it's a clear sign that stocks are outperforming gold. This is your green light for a bullish bias. The market is rewarding risk-taking, so you should be hunting for aggressive long setups in leading stocks.
- A Falling Ratio Trend: When the chart is heading down, making lower highs and lower lows, gold is the stronger horse. This is a flashing yellow light, signaling a time for a defensive bias. Your priority should shift toward capital preservation. That might mean taking smaller positions, being quicker to take profits, or even looking for short opportunities in weak stocks.
The real power here is clarity. By establishing your bias first, you immediately filter out a huge amount of market noise. You’re not just reacting to every little wiggle; you’re operating from a coherent, strategic framework.
Tuning Your Position Size and Sector Focus
Once your bias is set, everything else should flow from it. This is where the ratio directly impacts your risk management and trade selection.
This isn’t about being 100% in or 100% out of the market. It’s about dialing your risk up or down to match the environment. A falling ratio doesn't mean you have to stop trading stocks, but it absolutely means you should trade them differently.
Here’s a practical breakdown with actionable insights:
- When the Ratio is Rising: These are favorable conditions. This is the time to increase your position sizes on high-conviction ideas. An actionable step is to focus scans on high-beta sectors that thrive in risk-on markets, like Technology (XLK), Consumer Discretionary (XLY), and Industrials (XLI).
- When the Ratio is Falling: This is your cue to pull back on the throttle. A clear action is to reduce your average position size and tighten your stop-losses. Pivot your attention toward defensive sectors that tend to hold their ground when things get choppy, such as Utilities (XLU), Consumer Staples (XLP), and Healthcare (XLV).
By letting the ratio guide your sector exposure and risk, you’re systematically putting your capital where the momentum is. You’re giving your trades a powerful tailwind instead of trying to swim against the current.
Bringing It All Together with OpenSwingTrading
So, you've got the Dow-to-Gold ratio giving you the big-picture "weather forecast"—whether we're in a "risk-on" or "risk-off" season. That's a huge piece of the puzzle. But it doesn't tell you which specific stocks to trade. This is where you zoom in from the 30,000-foot view to street-level execution, using a platform like OpenSwingTrading to turn that macro signal into a concrete trading plan.
Think of it like this: the ratio tells you if the wind is right for sailing. Our tools help you find the fastest boat in the fleet and chart the best course. Marrying macro awareness with sharp stock selection is what separates consistently profitable traders from the crowd, especially in the kind of markets we're navigating in 2026. This fusion of macro and micro analysis is a core benefit of the open swing trading philosophy.
From a Macro Signal to a Killer Watchlist
Let's walk through a real-world scenario. Say the Dow-to-Gold ratio is rolling over and trending down, screaming market weakness and a defensive mindset. Your gut might tell you to sit on your hands, but great opportunities are often hiding in plain sight during pullbacks. A falling ratio is the perfect cue to fire up OpenSwingTrading and hunt for the exceptions.
First, you can use our market breadth indicators to confirm the weakness is real and widespread. Then, you can dive into our daily rankings of over 4,500 stocks to find the handful of leaders that are bucking the trend. These are the names showing incredible relative strength, the ones attracting big money while everyone else is running for the exits. This flips a defensive signal into an offensive search for quality. This actionable insight—finding strength in weakness—is a hallmark of a skilled swing trader.
Now, what if the ratio is rocketing higher? The game changes. You're not looking for survivors; you're hunting for superstars. Our platform lets you instantly cut through the noise and spot the high-momentum stocks coiling for a breakout, focusing your capital on names with the most firepower.
Your real edge comes from connecting the why (the ratio's signal) with the what (the specific stocks to trade). This creates a system that replaces emotion and guesswork with a repeatable, data-driven process.
Building Your Focus in TradingView
The ultimate goal is a tight, focused watchlist. OpenSwingTrading makes this dead simple. Once you've found a handful of top-tier candidates that fit the current market mood, you can easily get them into a platform like TradingView for a closer look.
Here’s a simple, effective workflow:
- Get the Macro Read: Check the Dow-to-Gold ratio trend to establish your bias (bullish or bearish).
- Check the Internals: Use our platform’s market health indicators to see if the market's "engine" supports your bias.
- Find the Leaders: Filter our daily stock rankings to isolate the strongest stocks in the strongest sectors.
- Export and Dig In: Build a curated watchlist in TradingView with just these high-potential names and start your detailed technical analysis.
Following this process ensures you aren't just chasing random squiggles on a chart. You're focusing your technical skills on stocks that have already passed a critical strength test. That alignment—knowing the big-picture trend is at your back—is what gives you the confidence to pull the trigger when your setup finally appears.
A Practical Trading Walkthrough for Today's Market
Alright, let's move from theory to the trading desk. I want to walk you through a hypothetical scenario for 2026 to show you how a discretionary swing trader would actually use the Dow to gold ratio. This is where we bridge the gap between the big-picture macro view and the nitty-gritty of picking individual stocks with the OpenSwingTrading platform.
The very first thing we do, before even looking at a single stock chart, is to get a read on the overall market environment. We start by checking the ratio to set our bias—are we playing offense or defense?
Analyzing the Macro Climate
First, we look at the ratio's current level and where it's been heading. Let's say it's early 2026, and the Dow to Gold ratio is sitting around 10.63. That’s a massive drop from its 20.05 peak back in November 2021.
What does that tell us? It shows gold has been on an absolute tear, roaring past $4,000 per ounce. This rally was so strong that it outpaced the stock market, even as the Dow hit 47,369 in late 2025. This steep, downward trend in the ratio is a huge red flag. It’s a classic signal that gold is taking back control, screaming a defensive, risk-off message to anyone paying attention. For a deeper dive into these cycles, you can explore the historical context of the Dow Gold Ratio.
With the ratio falling hard, our macro conclusion is simple: this is not the time to be a hero. An environment like this is hostile to aggressive, broad-based long positions. The game shifts from chasing gains to protecting capital and picking our spots very, very carefully.
A falling Dow to Gold ratio doesn't mean you stop trading stocks. It means you must become laser-focused, hunting for the rare pockets of strength that can perform well even when the broader market is struggling.
Translating Insight into an Actionable Plan
Now, we pivot from the macro view to the micro, using the OpenSwingTrading platform to put this defensive bias to work. A falling ratio completely changes what we're looking for in potential trades. Forget high-beta, high-flying momentum names; we're now on the hunt for resilience.
Here’s exactly how a trader would execute this, step-by-step:
- Confirm Market Health: The first stop on the platform is the market breadth indicators. If our macro read is right, we should see signs of sickness under the surface—more stocks hitting new lows than new highs, for instance. Seeing this confirms our cautious stance is justified.
- Pinpoint Defensive Sector Leadership: Next, we follow the money. In a risk-off market, big institutions usually rotate capital into safer havens. We’d check our sector rankings to see if money is flowing into Utilities, Consumer Staples, or Healthcare. This confirms the market is playing defense right alongside us.
- Isolate Relative Strength Leaders: This is the most important step. We run a filter on our daily rankings of over 4,500 stocks, but we're looking for something specific: individual stocks showing exceptional relative strength in a weak market. We want the names that are holding firm or, better yet, hitting new highs while the major indexes are getting hammered.
- Build a Hyper-Focused Watchlist: From this highly filtered list, we'll pull out the top three to five candidates. These are the best of the best—the stocks that have passed both our macro and micro tests. They are the strong boats in a stormy sea. This small, curated list is then moved over to TradingView for detailed chart analysis, where we nail down our exact entry points, stop-loss levels, and position size.
This methodical process forces our trades to be in sync with the market's underlying message. By starting with the Dow to gold ratio, we build a solid strategic foundation. We then refine it with granular, stock-level data to uncover high-probability swing trades, showing just how powerful a structured approach can be.
Common Questions About Using the Dow to Gold Ratio
Even after you've got a handle on the Dow to Gold ratio, some real-world questions always pop up when you start putting it to use. With all the market shifts we've seen leading into 2026, traders are trying to figure out exactly how this big-picture indicator fits into their daily routine. Let's tackle the most common questions head-on.
These aren't just hypotheticals; they're the practical hurdles traders face every day. The answers should help clear things up and give you the confidence to apply the ratio effectively.
How Often Should a Swing Trader Check the Ratio?
Think of the Dow to Gold ratio as your long-range weather forecast, not the hourly temperature. For a swing trader, checking it weekly or monthly is more than enough. Its real value is in spotting the major, multi-month shifts in market sentiment, not in reacting to day-to-day noise.
Use it to set your strategic bias for the weeks ahead. An actionable insight is to use your weekly review to check the ratio's trend, which then dictates your aggression level for the coming week. It helps you decide whether to play offense (aggressively seeking long setups) or defense (being more selective and managing risk tightly).
Can the Ratio Stay High or Low for Long Periods?
Absolutely. History is full of examples where the ratio stayed in a "high" (favoring stocks) or "low" (favoring gold) regime for years, sometimes even decades. We saw it trend up for nearly two decades from 1980 to 1999, and then it flipped, trending down for more than ten years from 1999 to 2011.
As a swing trader, you aren't trying to nail the absolute peak or trough of these massive cycles. Your job is to figure out the direction of the current long-term wave and trade in harmony with it. This patience and alignment with the primary trend are key benefits of swing trading.
Does a Falling Ratio Mean I Should Short Stocks?
Not necessarily. A falling ratio just tells you that gold is outperforming the Dow. That can happen in a few different ways: stocks might be going nowhere while gold is ripping higher, or stocks could be dropping while gold is simply holding its ground better.
Instead of seeing it as a blanket "short stocks" signal, think of a falling ratio as a bright yellow caution flag. An actionable insight here is to use it as a trigger to:
- Get much more selective with any new long positions you're considering.
- Tighten up your risk management, maybe by using smaller position sizes.
- Focus heavily on relative strength to find those rare pockets of the market that are still working.
Is This Ratio Still Relevant with Modern Assets?
It’s as relevant as ever. The ratio cuts through the noise to track the fundamental tug-of-war between traditional risk assets (stocks) and the ultimate historical safe haven (gold). New assets come and go, but big institutional money still flows between equities and gold based on timeless principles of risk appetite and fear.
Because of this, the Dow to Gold ratio continues to give us a pure, powerful signal of that classic dynamic.
OpenSwingTrading delivers the data-driven clarity you need to sync your trades with the market's true rhythm. Go beyond basic charts and find the high-performance leaders poised for breakouts. Start your 7-day free trial.