How Industry Leading Stocks Form During Rotation
An explainer on how market rotation manufactures the next generation of industry-leading stocks—follow the formation sequence from narrative-driven flows to accumulation and breakout, understand why leaders cluster via shared factors and ETF/analyst feedback, and use internals like relative strength, breadth, and volume to spot sponsorship early.
Why do the same few stocks seem to “come out of nowhere” and then dominate an entire rotation? It’s rarely luck—and it’s almost never just fundamentals.
Rotation has a hidden engine: capital crowds into narratives, flows tighten supply, and the market starts selecting leaders through price action. This explainer walks you through the typical formation sequence, why winners tend to cluster in groups, and the internals that reveal sponsorship before the trend looks obvious. You’ll finish with a practical anatomy of what a true leader looks like.
Rotation’s Hidden Engine
Sector rotation is capital moving from one group of stocks to another as conditions change. It concentrates money into a few “best homes,” not the whole market at once.
Think of it like musical chairs for portfolios. When rates, growth, or margins shift, someone loses a seat.
Capital seeks narratives
Money follows the story that just got upgraded. When macro signals flip and analysts revise earnings, capital hunts for the next sector where forecasts look easiest to beat.
A hike cycle can turn “long-duration growth” into “cash-flow now,” pushing money from software into energy or banks. The trades aren’t emotional. They’re career risk management.
If the narrative changes faster than fundamentals, rotation speeds up.
Flows create constraints
Big flows don’t buy “the sector.” They buy what the rules allow.
- Track index weights and rebalance mechanically
- Require high liquidity for large orders
- Obey risk limits and factor exposures
- Avoid names with wide spreads
- Concentrate into benchmark-heavy leaders
When constraints tighten, the same few tickers get hit again and again.
Leadership is selection
Rotation isn’t a wave that lifts everything. It’s a filter that promotes a few stocks into leadership, then starves the rest of attention.
Relative strength pulls in momentum money. Liquidity attracts institutions. Sponsorship shows up as repeated accumulation on weak days.
If you can’t spot the selection pressure, you’ll mistake noise for a new leader.
The Formation Sequence
Spark and re-rating
Rotation starts when the market reprices the future, not when headlines get loud. A policy shift, rate inflection, commodity squeeze, or new tech changes discount rates and growth math, fast.
You’ll see it in multiples before earnings, like “suddenly 18x is cheap.” That’s the first clue the market is building a new narrative.
Accumulation footprint
Before the breakout, institutions need time to build size without moving price. Your job is spotting that quiet control.
- Tight ranges after a selloff
- Higher lows on flat highs
- Volume dries up on dips
- Support holds on bad news
- Up days show heavier volume
When volatility compresses and support keeps winning, supply is getting removed.
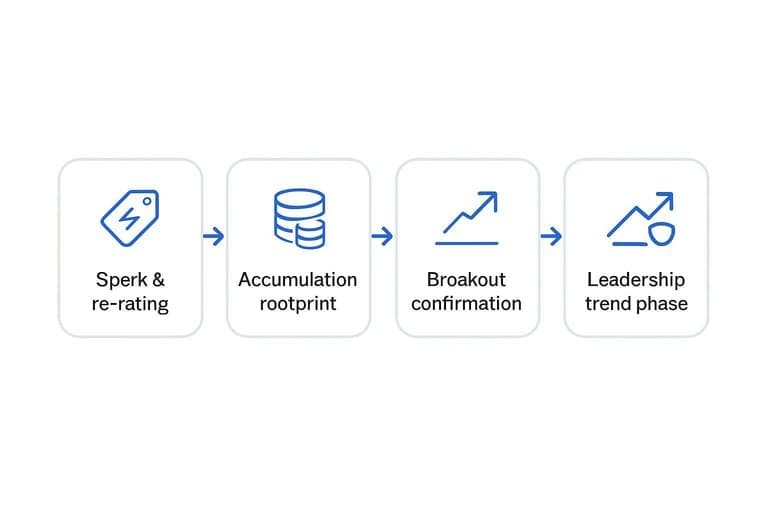
Breakout and confirmation
Breakouts work when sellers are already used up. Price can only lift cleanly after repeated tests absorb supply at the same level.
The follow-through often comes from two forced buyers. Trapped shorts cover, then benchmarked managers add because “it’s in motion” and peers own it.
Leadership trend phase
Trends persist when pullbacks stay controlled and demand keeps showing up. Treat it like a sequence you monitor, not a vibe.
- Let the first breakout run, then expect a shallow pullback.
- Watch support near the 20–50 day moving averages.
- Buy secondary breakouts from tight, mid-trend bases.
- Track the relative strength line making higher highs.
- Reduce risk if pullbacks widen and RS flattens.
Leadership is just persistent outperformance with disciplined defense.
Why Leaders Cluster
New leaders rarely appear alone because capital rotates by theme, not by ticker. When you spot “one strong stock,” you’re often seeing the first visible print of a whole group repricing. Think of Nvidia ripping first, then the rest of semis catching a bid.
Common factor exposure
Stocks in the same industry share the same levers, so they reprice together when the lever moves. Rates reset banks, oil prices reset refiners, and AI capex resets semis and data-center names with the same exposure.
When the driver changes, models update across the coverage universe at once:
- Discount rates and terminal multiples shift together.
- Input costs hit margins in the same direction.
- Demand signals flow through the same end markets.
- Capex cycles change backlog expectations.
That’s why “idiosyncratic strength” often isn’t idiosyncratic at all.
Analyst and ETF feedback
Once a group starts working, the market builds reflexive loops around it. Those loops pull in more buyers than the original fundamentals ever could.
- Analysts raise targets across peers.
- Index committees add winners on rebalance.
- Thematic ETFs funnel daily flows.
- Options hedging forces dealer buying.
When flows join fundamentals, the move stops needing a perfect story.
Supply chain signaling
Industries are networks, and networks confirm themselves. When an upstream supplier beats, then a downstream customer beats, investors stop calling it luck.
That cross-validation reduces uncertainty and expands the set of “safe” names to own. Institutions then sponsor the whole chain, from picks-and-shovels to branded winners.
The line that gets crossed is confidence, not valuation.
Internals That Reveal It
Leadership forms in the internals before it shows up in headlines. You see it in relative strength ratios and in breadth that quietly shifts from “some names” to “most names.” Catch that shift early, and you’re tracking rotation, not chasing news.
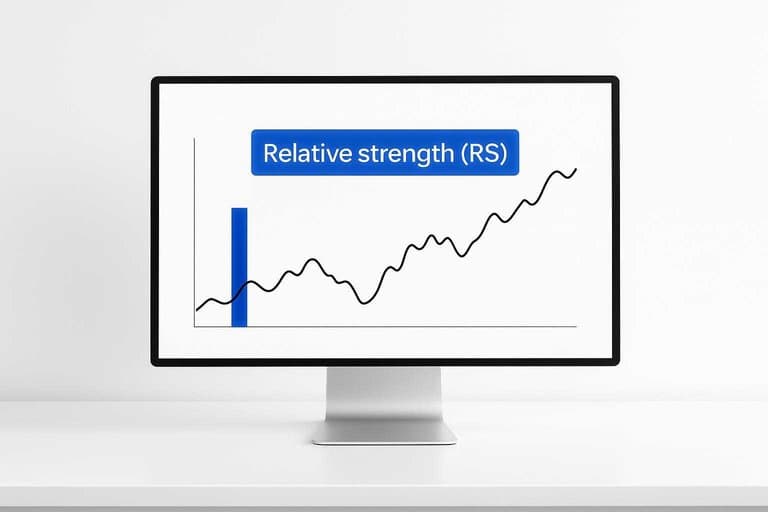
Relative strength math
Relative strength (RS) is a ratio: Stock price divided by a benchmark, like the S&P 500. When the ratio rises, the stock outperforms even if both are falling, like “down less” during a correction.
RS often turns first because it measures where marginal buying pressure is going. A leader can start outperforming while its absolute price still looks stuck.
Use it to separate rotation from market direction, because a rising ratio says “new sponsor,” not “good tape.”
Breadth within groups
Read group breadth to see whether leadership is concentrated or spreading.
- Check % above the 50DMA for the industry, not the index.
- Track new 52-week highs inside the group, then note higher lows.
- Watch the group’s advance/decline line for persistent net advancers.
- Compare leaders vs laggards weekly to spot narrowing or widening participation.
- Confirm the turn when breadth improves before the group ETF breaks out.
When breadth improves ahead of price, you’re looking at accumulation, not a one-stock story.
Volume tells sponsorship
Volume is the lie detector for “real demand” versus casual trading.
- Pocket pivots that clear prior selling volume
- Gap-ups that hold the opening range
- Low-volume pullbacks that respect key moving averages
- Heavy-volume reversals that reject breakdown levels
Price moves can be noisy, but sponsorship leaves footprints you can measure.
The Winner’s Anatomy
Rotation doesn’t pick winners at random. It rewards companies that can fund growth and absorb stress while price confirms demand.
| Trait | Emerging leader | Rotating laggard | What you’ll see on chart |
|---|---|---|---|
| Balance sheet | Net cash, low leverage | High debt, refinancing risk | Breakout holds, quick bids |
| Funding source | Free cash flow | Equity raises, asset sales | Rallies fade on volume |
| Earnings durability | Recurring, sticky revenue | Cyclical, one-off boosts | Higher lows into earnings |
| Guidance behavior | Raises, tight ranges | Walks back, wide ranges | Gaps up, stays above |
| Price structure | Tight base, clean breakout | Choppy range, failed highs | Volatility contracts first |
Use the table as a filter, then let price be the decider. That’s how you catch the leader early, not after the story peaks.
Track Rotation Like a Leader-Maker
Treat rotation as a process that manufactures leaders: a catalyst sparks a re-rating, accumulation leaves a footprint, and the breakout confirms that demand is overwhelming supply. Then validate the move with internals—relative strength versus the market, improving breadth inside the group, and volume that signals real sponsorship rather than noise. Finally, look for clusters: when several names in the same industry start checking the same boxes, you’re often seeing the selection mechanism at work, not isolated stock stories.
Frequently Asked Questions
Are industry leading stocks the same as market leaders or blue-chip stocks?
Not always. Industry leading stocks are the top performers within a specific industry group during a given cycle, while blue chips are usually large, established companies that may or may not be leading in relative performance right now.
Do industry leading stocks usually show up before or after a sector rotation becomes obvious in the news?
Usually before. Price and relative strength often turn up weeks to months ahead of headlines as institutions reposition and liquidity concentrates in the emerging winners.
How can I measure whether a stock is becoming an industry leading stock?
Track its relative strength line (vs. the S&P 500), performance vs. its industry ETF/peer basket, and accumulation signals like rising volume on up weeks using tools such as TradingView, MarketSurge, or Finviz.
Can I find industry leading stocks without buying right after a breakout?
Yes. Many leaders offer secondary entries like first pullbacks to key moving averages (often the 10-week/50-day) or tight consolidations after an initial run, which can reduce chasing risk.
How long do industry leading stocks typically stay leaders after rotation?
Often 3 to 12 months in a sustained uptrend, with the strongest names sometimes leading longer. Leadership usually fades when relative strength rolls over and the stock starts underperforming its group for several weeks.
Find Tomorrow’s Rotation Leaders
Spotting how industry leading stocks form is only useful if you can track relative strength, breadth, and rotation signals consistently as conditions shift.
Open Swing Trading updates daily RS rankings, breadth, and sector/theme rotation context across ~5,000 stocks so you can build a focused breakout watchlist in minutes—get 7-day free access with no credit card.