How to Find Stocks for Swing Trading: A Proven 2026 Workflow
Learn how to find stocks for swing trading with a data-driven workflow. Master market analysis, stock screening, and watchlist building for better results.
Before you even think about looking for a specific stock, you need a process. It’s a common mistake—and why so many traders in 2026 struggle—to jump straight into hunting for individual names without first understanding the bigger picture. This structured approach is a key benefit of swing trading, as it replaces emotional guesswork with a repeatable, logical system.
That's like trying to sail a small boat without checking the weather forecast first. You might get lucky, but you're just as likely to run straight into a storm.
A solid, repeatable workflow puts the odds in your favor from the very beginning. Instead of chasing random tips or reacting to news headlines, you'll be systematically aligning your trades with the market's most powerful forces. The idea is to focus your energy and capital where they’ll have the most impact, creating a more efficient and less stressful trading experience.
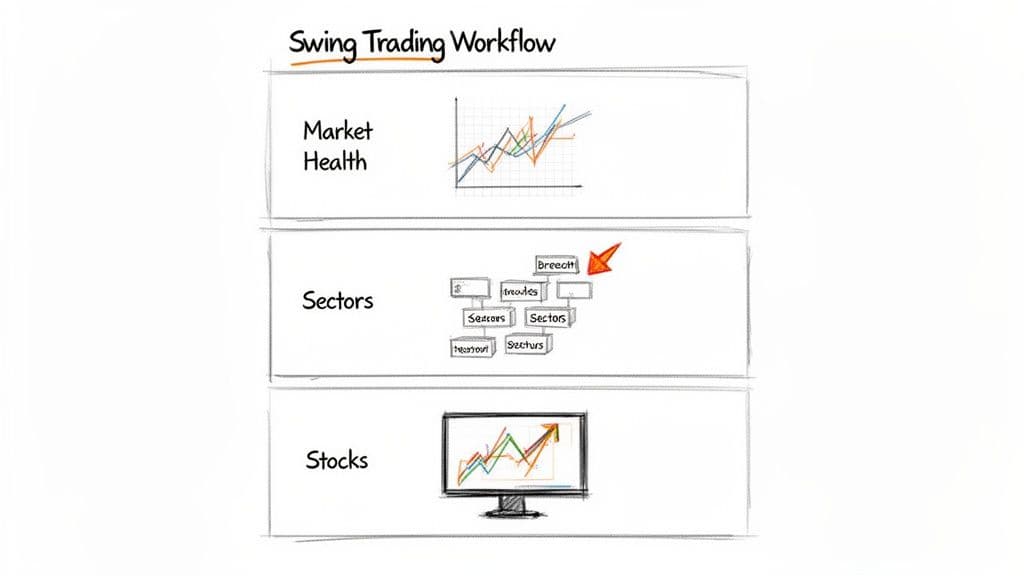
A Top-Down Approach for Finding A+ Setups
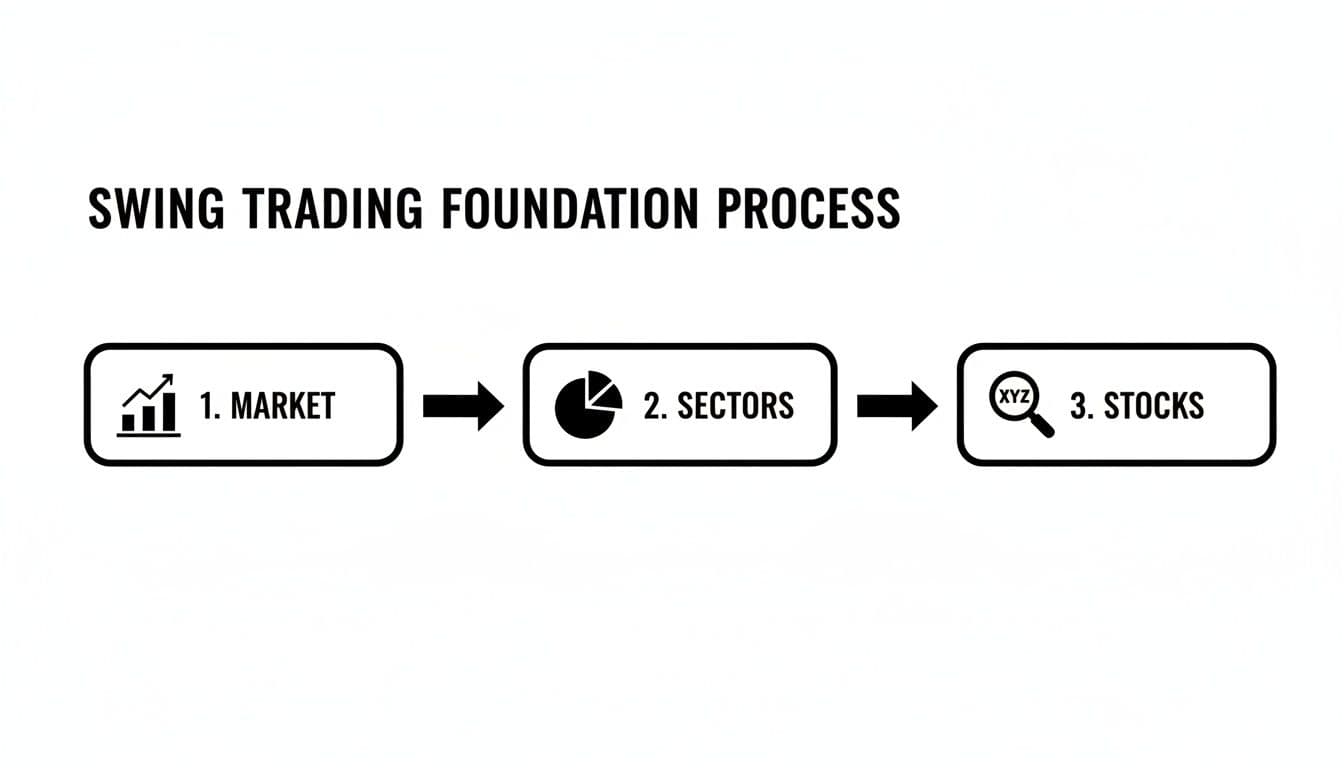
My entire process is built on a simple, top-down framework. It’s about filtering the thousands of available stocks down to a handful of high-probability candidates. It’s a three-tiered approach that keeps me on the right side of the trend.
- Read the Market: First, I take the market's temperature. Is it in a healthy uptrend, chopping around sideways, or bleeding out in a downtrend? This tells me whether to be aggressive and put capital to work or sit on my hands and protect it.
- Find Where the Money is Flowing: Next, I figure out which sectors and industry groups are attracting institutional capital. I want to trade in the "hot" neighborhoods of the market, not the ones everyone is leaving.
- Isolate the Leaders: Only after confirming a healthy market and identifying strong sectors do I start looking for individual stocks. The goal here is to find the leaders within those leading groups—the ones poised for the biggest moves.
This methodical flow ensures you're swimming with the current, not against it.
By consistently following this path, you make sure that every trade you even consider has strong market and sector tailwinds behind it. This is the core philosophy we use at OpenSwingTrading, and it’s how you can build a high-quality watchlist in just 5-15 minutes a day. This efficiency frees up your time, allowing you to focus on high-quality analysis rather than being chained to your screen.
Gauging Market Health to Time Your Trades
Jumping into a trade without first checking the market's overall health is a classic rookie mistake. It's like setting sail in a storm without bothering to check the weather—you might get lucky, but the odds are you're going to get sunk. Even the most perfect stock setup can, and likely will, fail if the broader market is falling apart.
That's why the absolute first step in my trading workflow is to take the market's temperature. This is a core principle we live by at OpenSwingTrading. Is the tide rising and lifting all boats, or is it going out, pulling even the strongest stocks down with it? This single piece of context dictates whether I should be aggressive or just sit on my hands.
Reading the Market's Internal Strength
To get a real, unbiased read on the market, I look beyond the headline indexes like the S&P 500 and dig into market breadth. Breadth indicators are fantastic because they show how many stocks are actually participating in a move, revealing the true health of a trend just beneath the surface.
A couple of my go-to indicators are simple but incredibly effective:
- Stocks Above Their 50-Day Moving Average: This tells me the percentage of stocks that are trading above their medium-term trend line. When this number is high and climbing (say, above 70%), it confirms a broad, healthy uptrend. If it's low and falling (below 40%), it’s a clear signal of widespread weakness.
- The Advance/Decline (A/D) Line: The A/D line is just a running tally of advancing stocks minus declining stocks each day. If the A/D line is hitting new highs right alongside the S&P 500, the rally is strong. But if the S&P 500 is pushing new highs and the A/D line is lagging? That's a major red flag that fewer stocks are doing the heavy lifting, and the rally might be running out of gas.
These tools stop you from buying into a weakening market or getting shaken out of a strong one. They provide the essential backdrop for every single trade I consider.
Why Fighting the Trend Is a Losing Game
When you align your trades with the dominant market trend, you give yourself a powerful tailwind. It’s not just a gut feeling; the numbers back it up. Historical data going back to 1950 shows that S&P 500 stocks trading above their 50-day moving average outperform by a whopping 12% annually on average during bull markets.
This simple metric is a cornerstone of our daily process at OpenSwingTrading, where we rank over 4,500 equities to help traders quickly build watchlists by focusing on market leaders when breadth is strong. Trying to short a stock that’s above its 50-day MA in a bull market is a low-probability bet—statistics show a 65% failure rate. Contrast that with buying pullbacks in a confirmed uptrend, where win rates can push toward 80%. You can learn more about how these levels influence trader psychology and why they are so significant.
The market's trend is the most powerful force in trading. Your primary job as a swing trader is not to fight it, but to identify it and ride it for as long as it lasts. Fighting the trend is a fast track to draining your account.
As we move through 2026 and beyond, with market conditions always in flux, ignoring these health checks is more dangerous than ever. By starting with this top-down analysis, you're making sure you only put capital to work when the odds are firmly in your favor. That discipline alone will dramatically improve your timing and keep you out of trouble when the environment turns hostile.
Zeroing In on the Leaders: Where the Big Money Plays
Once we've got a green light from the overall market, it's time to get specific. We need to find where the big institutions are putting their money to work. Forget trying to predict the next hot stock; our job as swing traders in 2026 is much simpler. We just need to spot the powerful trends already in motion and hop on for the ride.
This isn't about digging for undiscovered gems or bottom-fishing beaten-down stocks. That's a different game entirely. We're looking for the obvious winners—the stocks that are already leaving everything else in the dust. This is the absolute core of my process for finding high-potential swing trades.
It All Starts with Volatility-Adjusted Relative Strength
If I had to pick one metric to focus on, it would be relative strength (RS). Plain and simple, RS tells you how a stock is performing compared to the broader market, usually the S&P 500. A stock with high RS isn't just rising; it's decisively outperforming the average.
But there's a catch. A volatile biotech stock can spike 20% in a day, giving it huge short-term RS, but that's not the kind of leadership we want. We're looking for sustained, steady outperformance. That's why I always lean on volatility-adjusted relative strength, typically looking back over three to six months. This approach filters out the erratic, one-day wonders and shines a spotlight on the stocks that institutions are quietly and consistently buying.
I personally use OpenSwingTrading for this because it's built specifically to do this heavy lifting, ranking stocks daily to surface these true market leaders. It lets me completely ignore the laggards and focus only on where the real strength is.
Building Your Leadership Scan
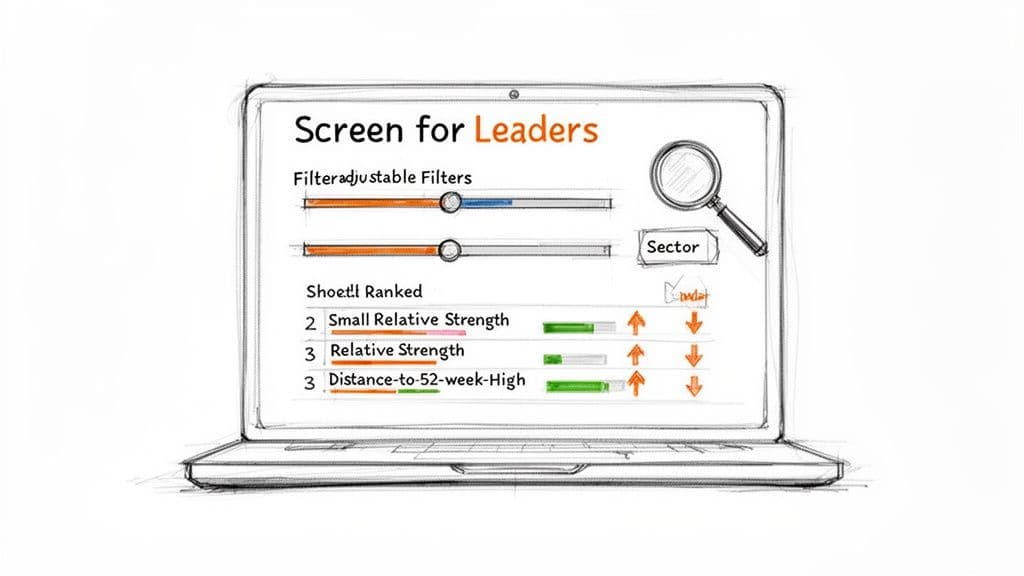
No matter what tool you use—a free screener like Finviz, a robust charting platform like TradingView, or a specialized service—the goal is the same. We need to build a filter that isolates liquid, strong stocks that are in established uptrends.
Here are the non-negotiable filters I run to kick off my search:
- Average Daily Volume: I need to see at least $20 million changing hands each day. This ensures there's enough liquidity for me to get in and out cleanly without moving the price against myself.
- Price: My cutoff is $10 per share. This is a simple way to weed out most of the low-quality, speculative penny stocks that are far too unpredictable.
- Proximity to 52-Week High: I only want to see stocks trading within 15-20% of their yearly high. True leaders are pushing into new territory, not stuck in the mud.
- Performance: This is the most important one. The stock absolutely must have outperformed the S&P 500 over the last three and six months.
This quick scan immediately cuts through the noise, shrinking a universe of thousands of stocks down to a focused list of real contenders.
The Statistical Edge You Gain
This focus on relative strength isn't just a "feel good" strategy; it gives you a tangible, statistical edge. The sweet spot I've found is targeting stocks that are outperforming the S&P 500 by at least 20-30% over a three to six-month period. When you layer that on top of strong sector momentum, historical data shows this approach can push win rates to around 62% with typical gains of 8-12% per trade in the U.S. markets. You can dig deeper into these swing trading statistics to see how powerful this can be.
Remember, screening isn't about finding stocks that might start going up. It's about finding the ones that are already showing undeniable strength and leadership. We're trend followers, not bargain hunters.
Following a data-driven process like this pulls your emotions out of the trading-decision loop. You stop chasing flimsy stories and hot tips. Instead, you're systematically aligning yourself with what the market has already proven to be working, which builds the confidence and consistency you need to succeed long-term.
Turning Scan Results Into an Actionable Watchlist
Running a stock scan is just the first step. What you get back is a raw, unfiltered list of possibilities—not a focused plan of attack. The real work in preparing for the trading day in 2026 is refining that list, transforming it from dozens of "maybes" into a handful of A+ setups you can act on with confidence.
Many traders make the mistake of trying to trade directly from their scan results. This almost always leads to impulsive decisions and sloppy entries because they haven't done the necessary homework on each name. A professional swing trader knows that this refinement process is where their edge is truly sharpened.
This crucial step involves manually reviewing each chart and performing a series of non-negotiable checks. The goal is to separate the truly elite setups from the merely good ones, ensuring every stock that makes your final list has the highest probability of success.
Performing Essential Due Diligence
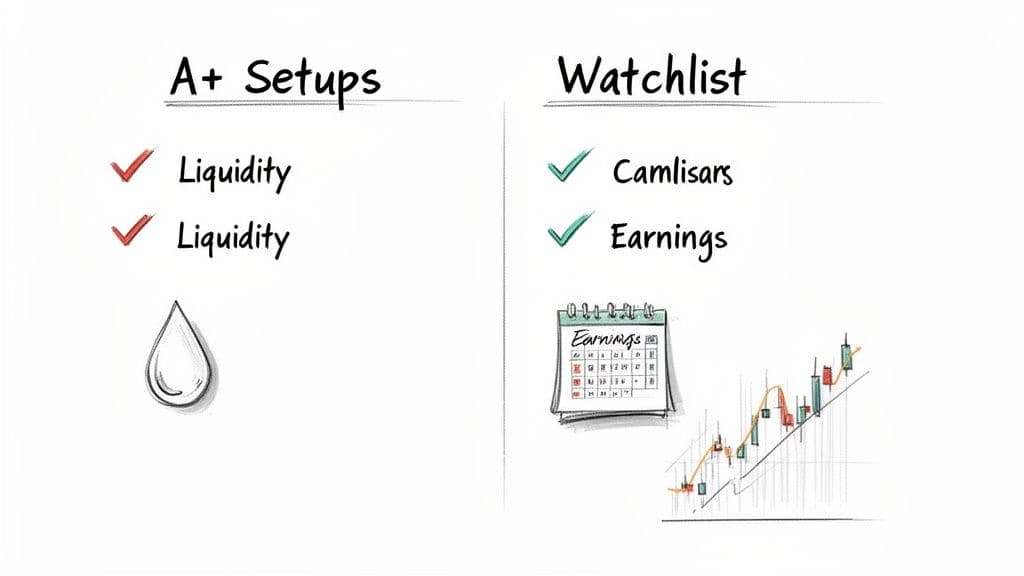
Before a stock even gets a spot on my preliminary watchlist, it has to pass two critical tests that scanners alone can't fully account for. These checks are designed to protect you from unnecessary risk and operational headaches.
First up is a liquidity check. Sure, your scanner might have filtered for a minimum average volume, but you need to visually confirm that the stock trades cleanly. Pull up a chart and look at the daily volume bars. Is the volume consistent, or are there massive, unpredictable spikes? An illiquid stock can have wide bid-ask spreads, making it difficult to enter and exit at a fair price—a hidden cost that erodes profits.
Second, you absolutely must check for upcoming earnings reports. Trading a stock into an earnings announcement is not swing trading; it's gambling. A surprise report can cause a stock to gap up or down 20% or more overnight, blowing right past your stop-loss. I always check the earnings date and avoid any stock with a report scheduled within the next couple of weeks. No exceptions.
Prioritizing Clean Price Action and Structure
Once a stock passes the basic checks, the real analysis begins. This is where you apply your chart-reading skills to evaluate the quality of the setup. Not all uptrends are created equal.
You're looking for clean, constructive price action. Here’s what separates a high-quality setup from a sloppy one:
- Orderly Consolidation: Is the stock building a tight, quiet base after a strong run-up? Look for patterns of volatility contraction, where the price swings get smaller and the volume dries up. This often signals that sellers are exhausted and the stock is gathering energy for its next move higher.
- Logical Support Levels: Does the stock have clear areas of support, like a key moving average or a prior breakout level? A stock that respects these levels shows institutional sponsorship and provides a clear area to define your risk.
- Avoid Extended Stocks: If a stock is already up five days in a row and stretched far above its short-term moving averages, it's extended. Chasing these names is a recipe for buying the exact top of a short-term move. It’s far better to wait for a constructive pullback or consolidation.
The best trades often feel the most obvious in hindsight because their price structures were clean and logical. Your job isn't to predict the future but to identify stocks that are behaving in a predictable, orderly fashion right now.
This qualitative analysis is a cornerstone of the OpenSwingTrading methodology. By manually vetting each candidate, you develop a feel for its personality, which leads to better-timed and more confident entries.
Building a Tiered Watchlist for Maximum Focus
The final step is to organize your refined list into a tiered structure. This prevents overwhelm and keeps you focused on only the best opportunities when the market opens.
- Primary List (A+ Setups): This is your hotlist, containing 5-10 stocks that look ready to move now. These are the names with clean consolidations, clear entry triggers, and ideal risk-reward profiles. They are your top priority.
- Secondary List (Developing Setups): This list is for promising stocks that need more time. Perhaps a stock is just starting to pull back to a key moving average or its consolidation is still a bit too loose. These 15-20 names are on deck, waiting for their patterns to mature into A+ setups.
This tiered approach transforms a long list of possibilities into an actionable trading plan. It ensures you start each day knowing exactly which stocks to watch and what conditions need to be met to pull the trigger. You're no longer reacting to random market noise; you're patiently waiting for your pre-vetted opportunities to come to you.
Defining Your Entry Triggers and Risk Controls
Finding a great stock in a strong market is a huge step, but honestly, it’s only half the battle. You can build the most beautiful watchlist in the world, but it means nothing without a rock-solid plan for execution.
This is the part that separates consistent traders from those who just spin their wheels. It's where you move from analysis to action, defining the hard-and-fast rules that will govern your trade from start to finish. We're talking about stripping out emotion and replacing it with a cold, calculated process.
Before you even think about clicking "buy," you need to know three things: precisely where you'll get in, exactly where you'll get out if you're wrong, and how much skin you'll have in the game. Without these rules, you're not trading—you're gambling.
Crafting Your Entry Tactics
A clear entry trigger is your signal to act. It's the specific, observable event on the chart that says, "Now!" Vague ideas like "I'll buy when it looks good" are a recipe for hesitation and missed trades.
As a swing trader in 2026, your playbook should be built around two time-tested tactics: breakouts and pullbacks. They serve different purposes, but both are designed to find low-risk entry points.
- Buying Breakouts from Consolidations: This is all about getting in right as a stock punches through a well-defined resistance level—usually a tight price range it's been stuck in for days or weeks. When that breakout happens on big volume, it’s a powerful sign that demand is in control and the stock is ready for its next leg up.
- Entering on Pullbacks to Key Levels: Instead of chasing a stock that’s already taken off, this strategy involves a little more patience. You wait for it to drift back down to a key support level, like the 21-day or 50-day moving average. Buying a temporary dip inside a larger uptrend often gives you a much tighter stop-loss and a better risk-reward ratio.
These aren't just abstract ideas. They are specific price actions you can spot and plan around. The right choice depends on the stock's personality and your own trading style.
Non-Negotiable Risk Management
Offense wins games, but defense wins championships. In trading, your defense is your risk management. This is the single most important habit that will keep you in the game for the long haul.
The cornerstone of your defense is the stop-loss. It’s your predetermined exit if the trade goes south. Crucially, your stop should never be based on some arbitrary number like "I'll sell if it drops 10%." That's amateur stuff.
Your stop-loss must be placed at a logical price level dictated by the chart itself. This means tucking it just below a key support level, the low of a consolidation pattern, or a major moving average. If the stock breaks that level, the entire technical reason for being in the trade is gone.
This technical approach ties your exit to the stock's actual behavior, not your feelings. It gives the trade room to work without exposing your account to a crippling loss.
Calculating Your Position Size
Okay, you know your entry point and you know where your stop-loss will be. Now for the final piece of the puzzle: your position size. This is how you make sure any single loss is just a small, calculated business expense.
The math is simple:
- Define Your Max Risk: First, decide the absolute maximum dollar amount you're willing to lose on one trade. For most pros, that’s somewhere between 0.5% and 1% of their total trading capital. So, on a 50,000** account, your max risk per trade would be **250 to $500.
- Calculate Your Per-Share Risk: Next, just subtract your stop-loss price from your entry price. Let’s say you plan to buy a stock at 105** and your logical stop is at **101. Your risk is $4 per share.
- Determine Your Share Count: Finally, divide your max risk by your per-share risk. Using our numbers: 250 / 4 = 62.5. You'd round down and buy 62 shares.
This simple formula ensures that if your stop gets hit, you lose your predetermined $250, give or take a few cents—nothing more. It standardizes your risk on every single trade, no matter the stock's price. Mastering this systematic approach to execution, a core principle taught by platforms like OpenSwingTrading, is what separates those who last from those who don't.
Common Questions on Finding Swing Trading Stocks
As you start to dial in your own method for finding swing trade candidates in 2026, some questions are bound to pop up. Let's tackle some of the most common ones I hear from traders. Getting these sorted out will help you build a solid strategy and trade with more confidence.
What's the Single Most Important Factor?
Hands down, it's making sure you're trading in sync with the overall market. You've heard the saying "a rising tide lifts all boats," and it's practically a law in trading. Your first job, before anything else, is to confirm the market is in a healthy uptrend using breadth indicators.
Once you’ve got that market tailwind, the next non-negotiable is high relative strength. You want to be fishing in the pond where the big fish are—stocks that are already crushing the S&P 500. A picture-perfect chart pattern on a stock in a bear market is a trap. Context is everything.
The quality of a stock's setup is secondary to the health of the overall market. A-grade setups in a D-grade market environment often result in failed trades. Always prioritize market health first.
By making sure both of these conditions are met, you're putting the odds massively in your favor before you even look at a single setup. It’s a simple discipline that can make a world of difference.
How Many Stocks Should I Actually Watch?
This is where focus becomes your superpower. A massive, bloated watchlist is a classic sign of an unfocused trader who doesn't really know what they're looking for. I've found a tiered system works best.
- Primary Watchlist: This is your "ready to go" list. Keep it tight—maybe 5-15 stocks that have A+ setups you're prepared to trade right now. These are your highest-conviction ideas with clean charts and obvious entry points.
- Secondary Watchlist: This can be a bit bigger, say 20-30 stocks. These are the names that look promising but aren't quite "there" yet. They might need a few more days to tighten up or pull back to a key moving average.
A smaller, curated list forces you to know your candidates inside and out. You start to get a real feel for their personality and price action, which leads to much sharper timing on your entries and exits. Tools like OpenSwingTrading are built specifically to help you filter thousands of names down to a manageable list like this in just a few minutes.
Can I Use Fundamentals for Swing Trading?
You absolutely can, but it has to be in a supporting role. For a trade lasting a few days or weeks, the chart and the market's mood are what's really driving the bus. The chart tells you what's happening, and the market tells you if it's likely to keep happening.
That said, strong fundamentals like killer earnings and sales growth can be the rocket fuel that ignites a major move. I often use fundamentals as a final quality check.
For instance, if I find a stock with a fantastic technical setup, I'll do a quick check to see if the company is fundamentally sound. This is especially powerful when the stock is part of a hot industry with a compelling story, because that's what attracts the big institutional money that can sustain a trend.
What are the Common Screening Mistakes I Should Avoid?
I see traders make the same handful of mistakes over and over again when they're screening for stocks. Just knowing what they are is half the battle.
- Screening in a Vacuum: This is the big one. Running scans without first checking the market's pulse is a recipe for disaster. Firing up a "new 52-week high" scan during a nasty market pullback will just give you a list of breakouts that are about to fail spectacularly.
- Overly Complicated Filters: More isn't always better. Piling on dozens of obscure indicators often filters out the very leaders you're trying to find. Keep it simple and stick to what matters: liquidity, relative strength, and price action.
- Ignoring the Actual Chart: Never, ever buy a stock just because it showed up on a scan. A screener is just a starting point. A stock can check all the boxes but have a choppy, unreadable chart. You have to put your eyes on it and confirm the price action is clean.
- Falling for the "Story": It's easy to get sucked into a company's narrative and ignore what the price is telling you. If a stock is breaking key support and its relative strength is tanking, it doesn't matter how great the story is. Price pays.
Sidestep these blunders, and your screening process will become a powerful tool that points you directly to the market's true leaders.
Ready to stop chasing random stocks and start focusing on high-probability leaders? OpenSwingTrading provides the data-driven market context you need to build powerful watchlists in just 5-15 minutes a day. Streamline your process for finding the best swing trading candidates by visiting https://openswingtrading.com and starting your free trial.