A Modern Guide on How to Swing Trade Stocks
Learn how to swing trade stocks with a definitive, modern guide. Discover a data-driven workflow for market analysis, stock selection, and risk management.
To really succeed at swing trading, you need to boil it all down to a simple, repeatable process. It's not about magic formulas or chasing hot tips. It's about a three-part rhythm: first, get a read on the overall market's health. Next, follow the money into the strongest sectors. Finally, pick out the absolute leaders in those sectors.
That’s it. This workflow stops you from chasing random stocks and instead aligns your trades with the big, powerful trends that actually move the market. The benefit is clear: you gain the flexibility to capture multi-day price moves—the swings—that can build an account without being chained to your screen.
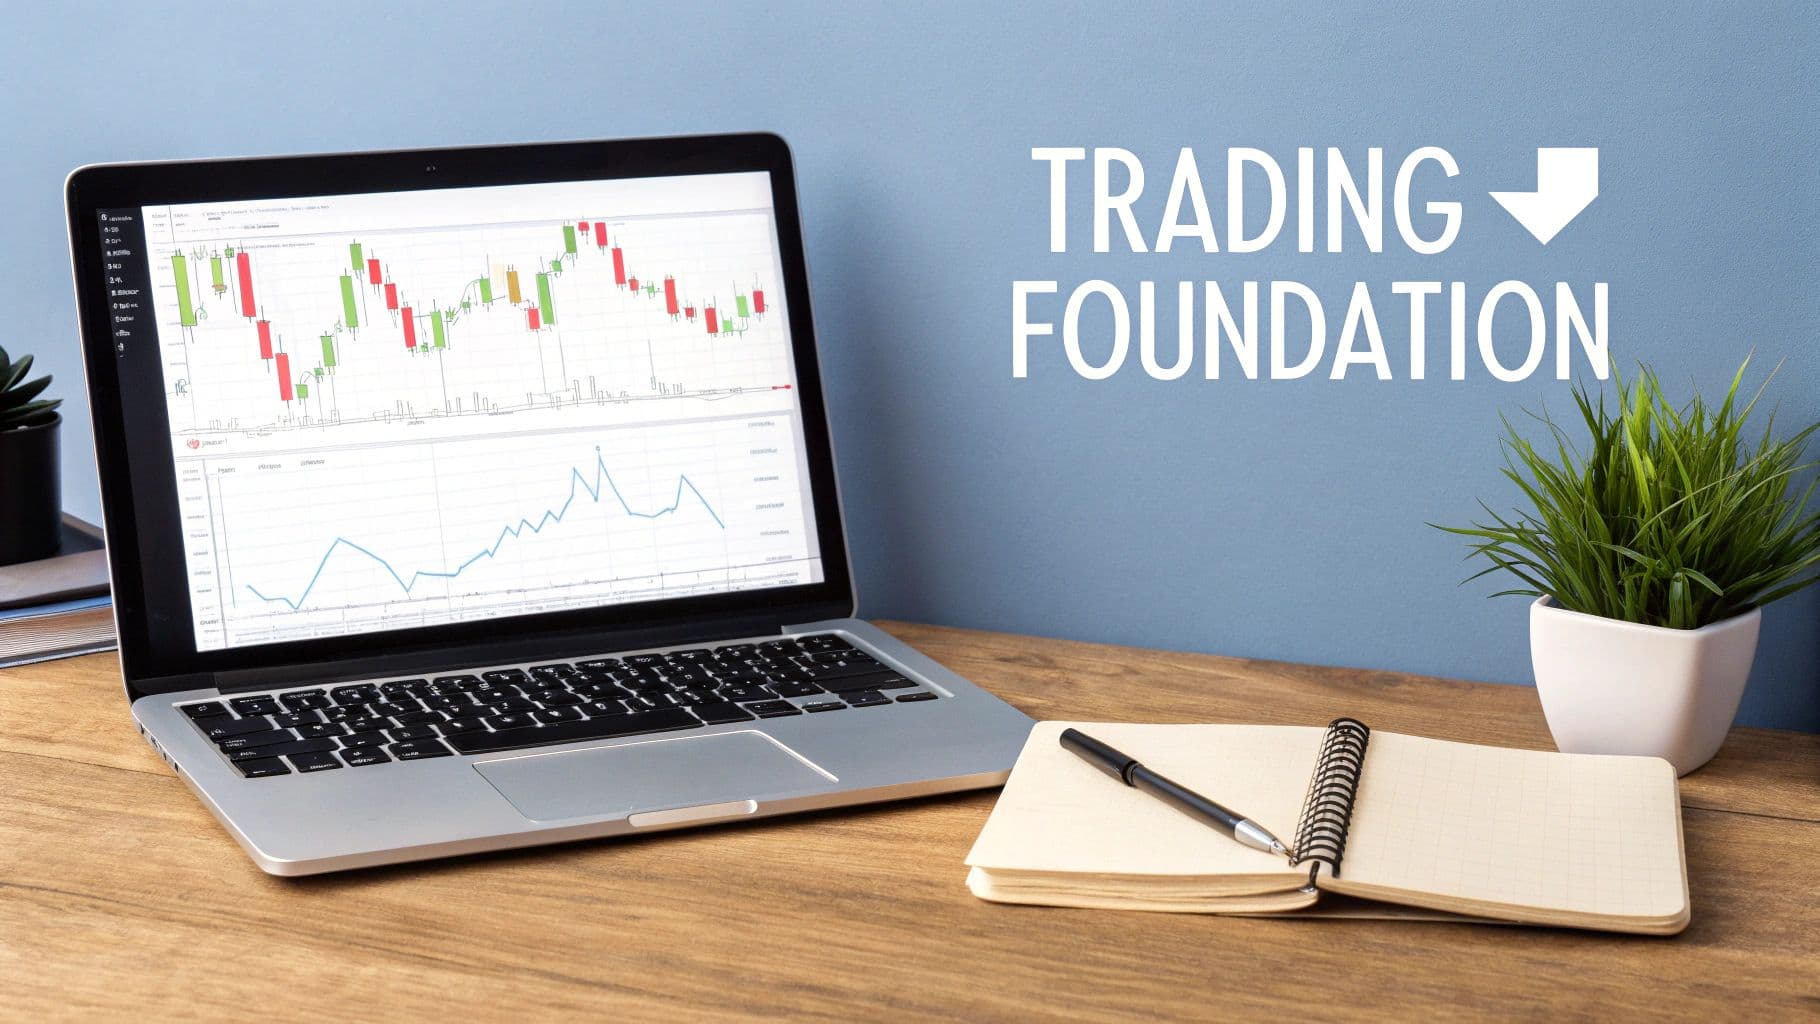
Building Your Foundation for Modern Swing Trading
Welcome. If you're looking to build a real, sustainable approach to swing trading in 2026 and beyond, you're in the right place. The key to consistency isn't about cluttering your charts with dozens of indicators or acting on a hot tip you saw on Twitter. The philosophy is much simpler and far more powerful: swim with the current, not against it.
This guide will walk you through a practical, step-by-step workflow that works in today's markets. We'll focus on aligning your trades with the market's overall direction and concentrating your capital on the strongest stocks within the most powerful sectors.
Why a Data-Driven Approach Is Essential
Years ago, traders could get by with a good eye for chart patterns and a bit of gut feel. Those days are largely gone. Today, the sheer volume of market noise is overwhelming. To find a real edge, you need data.
This is where a data-driven approach becomes your best friend. It helps you filter out the noise and make objective decisions. Tools like OpenSwingTrading are built specifically for this, showing you exactly where institutional money is flowing so you're not just guessing.
Following a structured method like this brings some huge benefits:
- Clarity and Focus: Instead of staring at thousands of stocks, you'll quickly narrow your universe down to a small, manageable watchlist of the best potential candidates.
- Increased Confidence: When your decisions are backed by hard data, emotion takes a backseat. You're not hoping for a win; you're executing a well-defined plan.
- Time Efficiency: This entire process can be done in just 5–15 minutes a day after the market closes. This gives you the freedom to trade effectively while maintaining your day job and personal life.
The Three Pillars of a Data-Driven Workflow
Let's be realistic. You won't win every trade. Professional swing traders often operate with win rates between 35-50%, but their wins are meaningful, often targeting returns of 12-45% per trade. They achieve this by respecting the market environment. Rigorous backtesting has shown time and again that specific technical patterns have a statistical edge, but only when applied in the right market conditions. You can learn more about the potential returns from swing trading setups to get a better sense of what's possible.
This entire guide is built around the simple workflow I mentioned earlier. It’s designed to make sure you’re always trading along the path of least resistance.
This table gives you a bird's-eye view of the three core pillars that form the foundation of our entire process.
The Three Pillars of a Data-Driven Swing Trading Workflow
| Pillar | Objective | Key Action |
|---|---|---|
| Market Health | Determine if it's a good time to be aggressive (risk-on) or defensive (risk-off). | Analyze market-wide breadth, trends, and key index levels. |
| Sector/Theme Flow | Identify where institutional capital is moving. | Scan for the top-performing sectors and themes showing relative strength. |
| Stock Selection | Pinpoint the strongest stocks within the leading sectors. | Find stocks breaking out from solid technical bases with high relative strength. |
Each pillar builds on the one before it, creating a logical filter that dramatically improves your trade selection and timing.
The goal isn't to be right on every single trade. The goal is to have a system that puts the odds in your favor over a series of trades. That begins with only fishing in ponds where the fish are actually biting.
Throughout this guide, we'll break down each of these pillars into clear, actionable steps. For now, just getting this high-level framework locked in is the most important thing you can do. It's the mental model for your new trading routine.
How to Read the Market and Follow the Money
Before you even glance at a single stock chart, you need to answer one question: What is the market actually doing? It's a simple idea, but most traders skip it.
Imagine trying to sail a small boat during a hurricane. It doesn't matter how well-built your boat is if the entire ocean is against you. Swing trading is no different. The very first thing I do is figure out if we're in a risk-on environment where it pays to be aggressive, or a risk-off market that demands caution.
Getting this right dramatically shifts the odds in your favor. You stop fighting the current and start riding the powerful waves created by big-money institutions.
Gauging Market Health Beyond the S&P 500
Checking the S&P 500 or Nasdaq is a good start, but it’s just scratching the surface. A truly healthy market has broad participation—meaning lots of stocks are moving up together, not just a handful of mega-caps propping up the index. This is where market breadth becomes your best friend.
Market breadth indicators tell you how many stocks are advancing versus declining. The classic example is the Advance-Decline (A/D) line. When the A/D line is hitting new highs right alongside the S&P 500, that’s your confirmation of a healthy, broad-based rally.
But if the S&P 500 is pushing to new highs while the A/D line is slumping? That's a massive red flag. This divergence tells you that fewer and fewer stocks are carrying the load, a classic sign of underlying weakness.
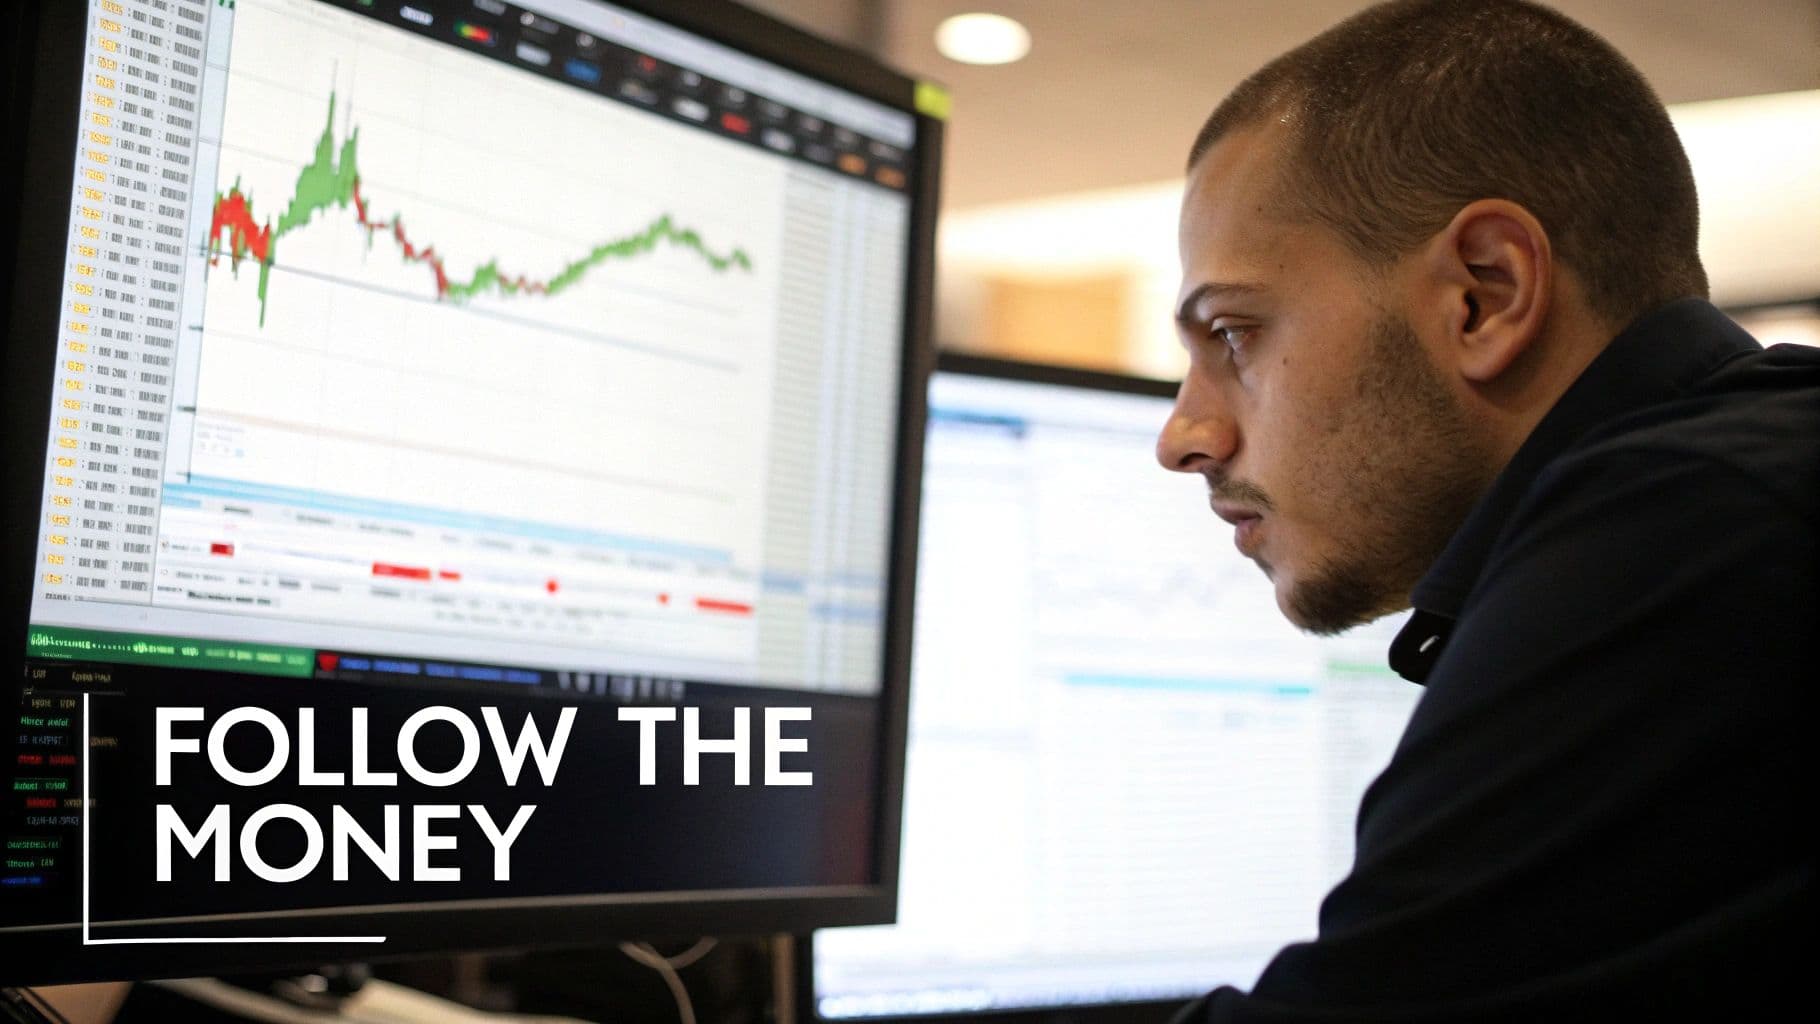
Following Institutional Footprints
Okay, so the market looks healthy. Now what? The next step is to find out where the big money is going. Institutions like hedge funds and mutual funds can't just sneak in and out of positions; their massive orders leave clear footprints. We can see these footprints by looking at sector and industry strength.
This is where a data-driven tool like OpenSwingTrading becomes a game-changer. Instead of spending hours sifting through charts, you get a daily snapshot highlighting exactly which corners of the market are attracting serious capital.
Let's say in early 2026, the overall market takes a hit, but you see money rotating heavily into cybersecurity and semiconductor stocks. That’s your clue. It tells you that despite the short-term noise, institutions are placing their long-term bets on these themes. This is your signal to start hunting for trade setups within those specific groups.
The professional's advantage isn't in predicting the future; it's in recognizing the present reality of capital flow and aligning with it. You don't need a crystal ball when you have a map showing where the money is going.
This simple shift in focus keeps you locked on the most powerful trends. You stop wasting time and mental capital on stocks in weak sectors that are going nowhere. Instead, you're free to concentrate only on the highest-potential areas of the market. This discipline is a cornerstone of learning how to swing trade stocks effectively.
A Real-World Scenario
Let's walk through a practical example from 2026.
- First, Check Market Health: A quick look at your breadth indicators shows the A/D line is strong and confirming the uptrend in the major indices. Green light. It's time to look for aggressive long-side trades.
- Next, Follow the Money: You log into OpenSwingTrading and check the daily sector flows. The data is crystal clear: Renewable Energy and Biotechnology have the highest momentum scores and are vacuuming up capital.
- Finally, Build a Watchlist: With this information, you can ignore everything else. Your entire focus narrows to just these two leading sectors. You now have a targeted pond to fish in, rather than trying to boil the entire ocean.
This straightforward, repeatable process ensures you are always positioned in harmony with the market's most powerful forces. History backs this up. The S&P 500 has delivered 10.5% annualized returns over the last century, proving the power of aligning with broad market trends. For traders, seasonal stats can add another edge; for example, over the past 20 years, months like March through July have historically been strong, giving a nice tailwind to well-timed trades. You can explore more about historical market returns and how they inform trading strategies.
Finding Market Leaders for High-Probability Setups
Alright, you've got a solid read on the market's health and you know which sectors are catching the big money flows. Now for the fun part: the hunt. This is where we shift from a wide-angle view of the market to a microscope, zeroing in on the individual stocks with real explosive potential.
The goal isn't just to find a stock that's moving up. We're looking for the true market leaders.
These are the stocks showing incredible relative strength, meaning they’re consistently crushing both the S&P 500 and their direct competitors. Think of them as the star players on the winning teams. Trading these names is like putting a powerful tailwind at your back.

From Broad Sectors to a Focused Watchlist
Let’s be real—manually sifting through thousands of stocks to find these gems is impossible. This is where a good data-driven tool becomes your best friend. Instead of drowning in endless charts, a platform like OpenSwingTrading does the heavy lifting for you.
The process is surprisingly simple. Once you’ve identified your target sectors (say, Cybersecurity and Renewable Energy), you just pull up the daily equity rankings. Instantly, you can see which stocks in those groups have the highest relative strength scores.
This single step filters out 99% of the market noise. You’re no longer guessing. The objective data is showing you exactly which names are already leading the pack. What you're left with is a small, curated watchlist of maybe 5-10 stocks that actually deserve your attention.
Your watchlist is your universe of opportunity. By populating it exclusively with data-vetted leaders, you ensure every trade you even consider already has a statistical advantage before you ever look at a chart.
Integrating Data with Your Charting Software
With your focused list in hand, it’s time to head over to your charting software, like TradingView. This is where you connect the "what" (the high-strength stock) with the "when" (the perfect entry point). I think of OpenSwingTrading as my strategic filter and TradingView as my tactical execution tool.
Here’s what this simple but powerful workflow looks like in practice:
- Import Your Watchlist: First things first, create a new watchlist in TradingView and plug in those 5-10 names. This keeps you laser-focused and stops you from getting sidetracked by random tickers.
- Scan for Setups: Now, just cycle through the charts for each stock on your list. What are you looking for? Clean, classic consolidation patterns.
- Identify A+ Patterns: Not all patterns are created equal. You want to see the stock digesting its recent gains in an orderly, controlled way.
This workflow is a game-changer, especially for anyone learning how to swing trade stocks. It forces you to build discipline and wait patiently for the market to hand you a clear, high-probability opportunity, instead of chasing trades out of boredom.
Spotting Classic Breakout Patterns
Market leaders don’t just shoot straight up. They make a powerful move, pause to consolidate and catch their breath, and then launch the next leg higher. Those consolidation periods are pure gold for us as swing traders.
Keep an eye out for these key patterns on the daily charts of your watchlist stocks:
- Flat Bases or Consolidations: This is when a stock trades sideways in a tight range for several days or weeks. It’s a healthy sign that buyers and sellers have found a temporary equilibrium before the next big move.
- Flags and Pennants: After a sharp, high-volume run-up (the "flagpole"), the stock drifts a bit lower or sideways on much lighter volume. This tells me the big institutions are holding their positions, just waiting for the next push.
The beauty of swing trading is that it lets you hold positions from a few days to several weeks, making it a great fit for busy people who use tools like TradingView to plan their moves. Platforms that scan thousands of stocks have proven that these technical setups have a real statistical edge. For instance, extensive backtesting of these patterns has shown 168,968 wins against 108,404 losses, producing an average annualized return of 79.4%. OpenSwingTrading sharpens this edge by ranking over 4,500 equities daily on metrics like relative strength, helping you find these breakout candidates much faster. You can find more detail on the success rates of different swing trading setups.
The final piece of the puzzle is waiting for the stock to break out from that consolidation on a noticeable spike in volume. That's your signal. That’s the moment the stock is likely ready to resume its uptrend, and it's your cue to get ready to enter.
Crafting Your Trade Blueprint
You've found it—a market leader coiling up, ready to pop. It's a textbook breakout pattern. For many traders, this is where the adrenaline kicks in, and the biggest mistake is made. They dive in headfirst, driven by FOMO, with zero plan.
But a great chart setup is just potential. It only becomes a high-probability trade when you wrap a rock-solid plan around it.
Think of this plan as your business contract for the trade. You're defining every single variable—your entry, your exit, your risk, and your potential reward—before a single dollar is at risk. This takes the emotion right out of the driver's seat. It's the difference between gambling and running a calculated business. More importantly, it’s what keeps you in the game.
Nailing Down Your Trade Parameters
Before your finger even gets near the "buy" button, you need to know three numbers with absolute certainty: where you’re getting in, where you’re getting out if you're wrong, and where you're taking profits. These aren't just guesses; they're strategic levels you pull directly from the chart.
Let's walk through a real-world scenario from 2026. Picture a hot cybersecurity stock breaking out from a tight consolidation at $150.
- The Entry Point: This is your trigger. For a breakout, a solid entry might be just a tick above the consolidation high, say at $150.10. This confirms the stock has the juice to actually move higher.
- The Stop-Loss: This is your "get me out" price. Where is the trade idea officially dead? A logical spot is just below the recent consolidation area, maybe at $145. If the price drops there, the breakout failed. You take the small, pre-defined loss and move on.
- The Profit Target: Where are you cashing in? A common approach is to look at a prior resistance level on the chart. Another way is to aim for a specific risk-to-reward ratio. Your risk here is 5.10** per share (150.10 entry - 145 stop). A **2:1** reward target would be **160.30, and a more ambitious 3:1 target lands you at $165.40.
Just by writing down these three numbers, you've turned a fuzzy idea into a concrete, actionable plan.
Position Sizing: The Secret to Staying in the Game
Alright, now for the single most important part of this whole process: position sizing. This is what truly separates the pros from the amateurs. It’s not about how much you can make on a winning trade; it’s about ensuring you lose as little as possible on the losers.
The golden rule here is the 1% rule. Simply put, you never risk more than 1% of your total trading capital on any one trade. So, if you have a 20,000** account, your maximum loss on a single idea is capped at **200. No exceptions.
Your primary job as a trader is not to make money, but to manage risk. Protect your capital first, and the profits will eventually take care of themselves. This mindset shift is everything.
With this rule locked in, we can figure out exactly how many shares to buy. The formula is simple:
Shares to Buy = (Max Dollar Risk) / (Per-Share Risk)
Let’s plug in the numbers from our cybersecurity trade:
- Max Dollar Risk: **200** (which is 1% of our 20,000 account)
- Per-Share Risk: **5.10** (the distance from our 150.10 entry to our $145.00 stop)
So, 200 / 5.10 = 39.2 shares. We'll round that down to 39 shares.
By buying exactly 39 shares, you've mathematically guaranteed that if the trade goes south and hits your stop, you'll lose just $198.90 (plus commissions)—right on your 1% risk target. This precision is your armor against career-ending losses. It means a string of small losses, which are an inevitable part of trading, can't knock you out. This is how you survive long enough for your winning edge to play out.
Developing Your Daily Trading Routine
If you think successful swing trading means being glued to a screen all day, stressing over every little price move, I've got good news. It's actually the complete opposite. Real, lasting consistency comes from a disciplined, repeatable process that takes the emotion and raw guesswork out of your trading.
The best traders I know do their real work in a short, focused window after the market closes. This is where they prepare for tomorrow. By building a powerful 5–15 minute daily habit, you can tune out all the intraday noise and position yourself to act with clarity when your setups actually trigger.
The Power of an End-of-Day Workflow
The whole point of a structured routine is to separate your thinking from your doing. When you do your analysis in the calm, quiet hours after the close, you're far less likely to make impulsive, emotional decisions based on fear or greed when the market is open.
Your goal is to have all the "what ifs" sorted out ahead of time. This means you know which stocks are on your watchlist, you’ve identified the potential setups, and you've already defined your exact entry and exit points. When the next trading day begins, it becomes a simple matter of execution—either the trade triggers at your price, or it doesn't.
This gives you a massive mental advantage. You're no longer reacting to the market's every whim. Instead, you're patiently waiting for the market to come to you. This is a core principle for anyone serious about learning how to swing trade stocks like a professional.
Here’s a quick-and-dirty checklist I use myself. It's not theory; it’s a practical routine you can put into action tonight.
Your 15-Minute Daily Swing Trading Routine
| Time Allotment | Task | Tool/Focus |
|---|---|---|
| First 5 Mins | Review Market Health & Sector Flow | Check OpenSwingTrading for the latest market breadth data and identify the top-performing sectors. Is the market still in a healthy "risk-on" mode? |
| Next 5 Mins | Update and Refine Your Watchlist | Based on the sector flow data, scan the relative strength leaders on OpenSwingTrading. Add new leaders to your watchlist and remove any laggards. |
| Final 5 Mins | Scan Charts for Actionable Setups | Take your small, curated watchlist over to TradingView. Quickly review each chart for clean breakout patterns and define your entry, stop, and target levels. |
This simple routine forces you to cover the most critical ground, from the big-picture market health down to a specific trade plan, all in a ridiculously short amount of time. It's all about being efficient and focused, not spending hours staring at charts.
The Critical Post-Trade Review Process
Your daily routine handles the prep work, but your long-term growth as a trader depends entirely on one final step: the post-trade review. This is the feedback loop that turns your wins and losses into actual skill. If you skip this, you're just gambling and hoping to get better.
This doesn't have to be some complex ordeal. After you close out a trade, just take a few minutes to log it and ask yourself a few honest questions:
- Did I follow my plan exactly?
- Was the entry and exit executed well?
- If I didn't follow the plan, why? Was it an emotional reaction or a tactical decision?
- What was the market doing, and what sector was hot when I took this trade?
Jotting this down helps you see beyond the profit or loss of a single trade and focus on the quality of your process. Over time, patterns will emerge. Maybe you'll notice you cut winners too soon in bull markets or let losers run too long when things get choppy.
This simple diagram shows how a solid trade plan is built, which is the bedrock of any useful post-trade review.
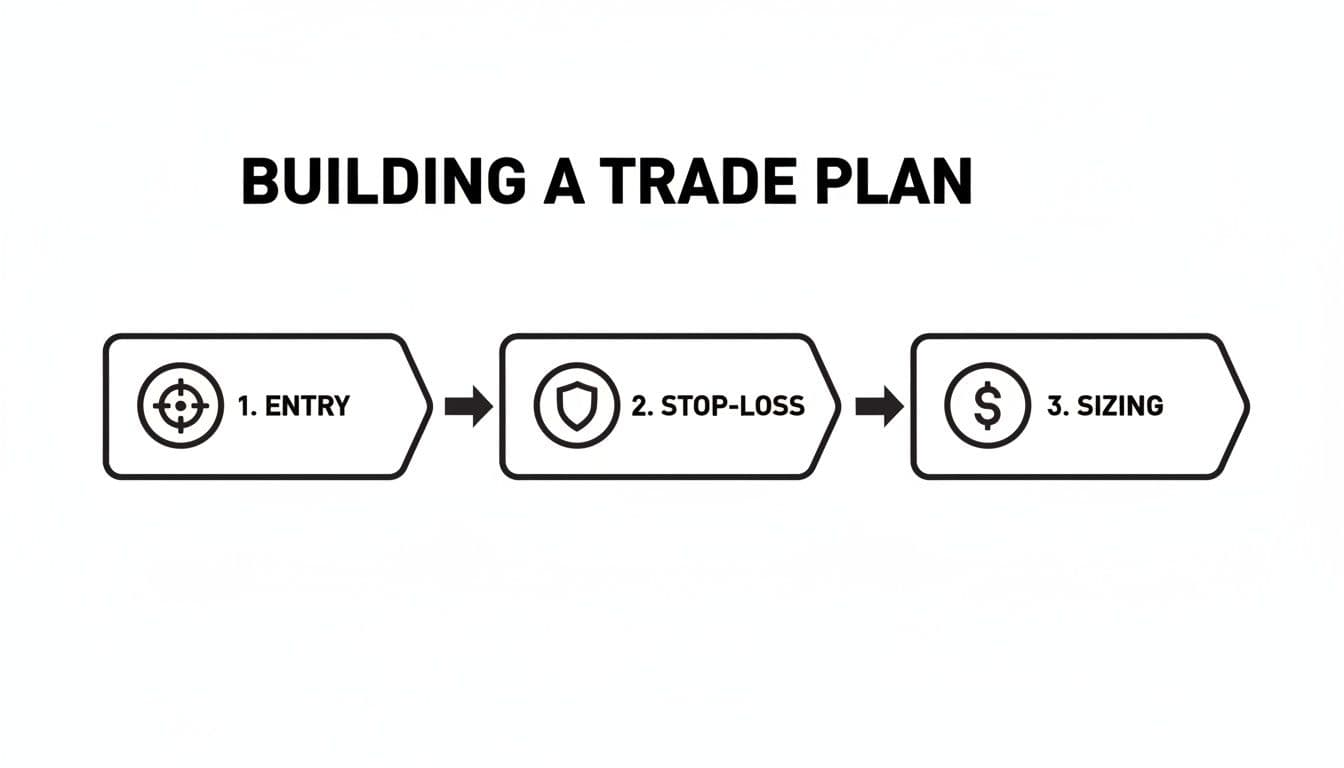
Defining your entry, stop-loss, and position size before you even think about clicking the buy button gives you the objective benchmark you need to judge your own performance.
This feedback loop—Plan, Execute, Review, Adapt—is the engine of improvement. It’s the single most effective way to identify your weaknesses, double down on your strengths, and refine your edge over time. For serious traders in 2026 and beyond, this isn't optional.
Common Questions I Hear About Swing Trading
As you get your hands dirty building a trading routine, you're going to have questions. That’s a good thing. The trading world is full of nuance, but over the years, I've found a few key questions pop up again and again. Getting these sorted out early is key to building real confidence.
Let’s walk through some of the most common ones.
What’s the Real Difference Between Swing Trading and Day Trading?
It all comes down to two things: your holding period and your daily time commitment. Day traders live in the fast lane. They’re in and out of positions within the same day, which means they’re glued to their screens, making decisions minute-by-minute. It’s a full-time job, and a demanding one at that.
Swing trading operates on a much saner timeline. We’re looking to hold positions for a few days to several weeks to capture a bigger, more meaningful "swing" in price. This completely changes the game. You get massive flexibility because all the heavy lifting—your analysis and trade planning—can be done in a focused 5-15 minute routine after the market closes. You don't have to watch every single tick during the day.
How Much Money Do I Actually Need to Start in 2026?
You could technically open an account with just a few hundred bucks, but let's talk about what's practical. To give yourself a real shot, I’d recommend starting with between 5,000 and 10,000 in 2026. This isn't an arbitrary number.
That amount is large enough to let you take a few different positions at once, so you can spread your risk instead of betting the farm on one trade. More importantly, it gives you a crucial psychological buffer. A string of small, managed losses is just part of the business. Having enough capital ensures those normal drawdowns don’t knock you out of the game before your strategy has a chance to work.
Your starting capital isn't just for making money—it's your runway. It’s there to help you survive the learning curve and the inevitable losing streaks. Being undercapitalized is one of the fastest ways to fail.
How Do I Make Tools Like OpenSwingTrading and My Charting Software Work Together?
Think of it as a two-step process that separates your high-level strategy from your on-the-ground tactics. This is how you avoid getting lost in an endless sea of charts and focus your energy only on the A+ setups.
Here’s how I use them together:
- OpenSwingTrading is for Strategy & Filtering: I start here every single day. I use the market analysis to get a quick read on the market's health. Then, I check the sector flows and relative strength lists to build a small, curated watchlist of the strongest stocks. This answers the question: "What should I trade?"
- TradingView is for Tactics & Execution: With that short, powerful list in hand, I jump over to my charting platform, like TradingView. This is where I zoom in and do the detailed technical work on just those few stocks. I’m looking for specific breakout patterns and defining my exact entry, stop-loss, and profit targets. This answers the question: "When and how should I trade it?"
This one-two punch is a massive advantage. It ensures your detailed chart work is only spent on stocks that are already confirmed leaders, which stacks the odds in your favor right from the start.
What Are the Biggest Mistakes New Swing Traders Make?
Almost every new trader stumbles into the same few traps. Just knowing what they are is half the battle. A disciplined, data-driven routine is your best defense against these classic emotional blunders.
- Fighting the Market: Going long when the market is in a clear downtrend is like trying to swim up a waterfall.
- No Exit Plan: Entering a trade without knowing precisely where you'll get out if you're wrong is just gambling.
- Betting the House: Risking a huge chunk of your account on a single "sure thing" is a recipe for a blown-up account. Always stick to the 1% rule.
- Chasing Hype: Buying a stock that’s already shot up 15% on the day is classic FOMO. You’re usually the last one to the party.
- Emotional Reactions: This is the big one. So many traders let their losers run, hoping they’ll "come back," while cutting their winners at the first tiny sign of profit.
Ready to stop guessing and start making data-driven decisions? OpenSwingTrading gives you the tools to assess market health, follow institutional money, and find the strongest stocks poised for a breakout.