Market breadth dashboard: how it works for swing traders
Market breadth dashboard: how it works for swing traders
An explainer on how a market breadth dashboard helps swing traders read participation and risk before price—core indicators (advancers/decliners, up/down volume, highs/lows, % above MAs, equal-weight), signal design (normalization, smoothing, thresholds), and a practical workflow for entries, sizing, and exits.
Ever have an index look “fine” while your watchlist quietly falls apart? That’s the trap of price: a few heavyweights can keep the chart green even as participation deteriorates underneath.
A market breadth dashboard makes that invisible information tradable. You’ll learn which breadth components matter, how to turn noisy internals into repeatable signals, and why breadth often leads turns in trend and volatility. By the end, you’ll have a simple workflow to diagnose market state, confirm entries, size risk, and tighten exits before the tape forces you to.
Table of Contents
- Breadth, not priceWhy price misleadsBreadth as participationDashboard promise
- Dashboard building blocksAdvancers/declinersUp/down volumeHighs/lowsPercent above MAsEqual-weight lens
- From raw to signalsNormalize by universeSmooth the noiseSignal archetypesThreshold logic
- Why breadth leadsDiffusion of buyingConcentration riskDealer positioning linkVolatility regime effect
- A swing-trader workflowMarket state firstEntry confirmationPosition sizingExit triggers
- Dashboard template
- Common traps
- Mental model: breadth engineDiffusion vs trendThree dashboard questionsWhat to ignore
- Put the dashboard to work on your next trade week
- Frequently Asked Questions
- Turn Breadth Into Leaders
Breadth, not price
Market breadth is your lie detector for index moves. Price can rise while participation shrinks, and your swing hold becomes a hostage to a handful of names. The dashboard compresses three signals—participation, leadership, and risk appetite—into a quick read you can use before you say “I’ll hold this for a week.”
Why price misleads
Cap-weighted indexes can look healthy even when most stocks are rolling over. If five mega-caps grind higher while the rest fade, your chart says “uptrend” but your odds say “fragile.” That’s the line that gets crossed when a multi-day hold depends on a few earnings calls.
When breadth diverges, pullbacks get sharper and recoveries get narrower. Your stop becomes the strategy.
Breadth as participation
Breadth measures how many stocks are actually participating in the move, not just how loud the leaders are. Think “advancers vs decliners,” “new highs vs new lows,” and “percent above the 20/50-day.” Those are swing-speed gauges because they move on the same 3–15 session rhythm you trade.
If participation is expanding, breakouts tend to follow through. If it’s contracting, you’re trading a headline, not a market.
Dashboard promise
You want a fast read before you add size or hold overnight. The dashboard answers three questions:
- Is the move broad across many stocks?
- Is participation improving day to day?
- Is leadership stable, not rotating violently?
- Is risk appetite supportive, not defensive?
- Is this strong enough for several sessions?
If you can’t answer “yes” twice, reduce time in trade or reduce size.
Dashboard building blocks
Market breadth indicators answer tiny micro-questions about participation, leadership, and conviction. Each one is just constituent math, then a framing choice.
Advancers/decliners
You want to know if the market is being pulled by a few names or carried by many. Daily A/D and the A/D line answer that with nothing but up-or-down closes.
Daily net advances = (# advancers) − (# decliners). The A/D line cumulates that value each session: A/D(t) = A/D(t−1) + net advances(t).
Cumulation turns “messy day-to-day noise” into a regime signal you can trade around.
Up/down volume
Price breadth can lie when winners trade on fumes and losers trade heavy. Up/down volume tags conviction by assigning volume to advancing or declining issues.
For each stock, label its day as up or down versus the prior close. Sum volume for all up stocks as Up Volume, and all down stocks as Down Volume; many traders also track a ratio like Up/Down Volume or a spread like Up − Down.
When volume confirms breadth, breakouts tend to stick longer than your average two-day pop.
Highs/lows
New highs and lows tell you where leadership is expanding or rotting. Use these inputs from the same constituent universe each day.
- Count 52-week highs
- Count 52-week lows
- Compute net new highs (highs − lows)
- Track cumulative net new highs
- Watch highs/lows as a percent of issues
If highs stop expanding while price rises, leadership is thinning.
Percent above MAs
You want trend participation, not just index direction. Percent above moving averages counts how many constituents are actually in-trend.
For each stock, test whether Close > MA(20), MA(50), or MA(200). Then compute %AboveMA = (count true ÷ total issues) × 100 for each window.
Use 20/50 for swing thrusts, and 200 for the cycle you should not fight.
Equal-weight lens
Cap-weighted indexes can look healthy when a handful of megacaps do all the work. An equal-weight lens forces every constituent to matter equally.
Build or use an equal-weight index, then compare it to the cap-weighted benchmark with a ratio like RSP/SPY. If the ratio rises, the median stock outperforms; if it falls, leadership is narrowing to the top names.
When equal-weight diverges, your “index read” is often just a megacap story.
From raw to signals
Daily breadth is messy because it mixes universe changes, one-day shocks, and regime shifts. Your job is to compress that mess into states you can trade for days, not minutes.
Normalize by universe
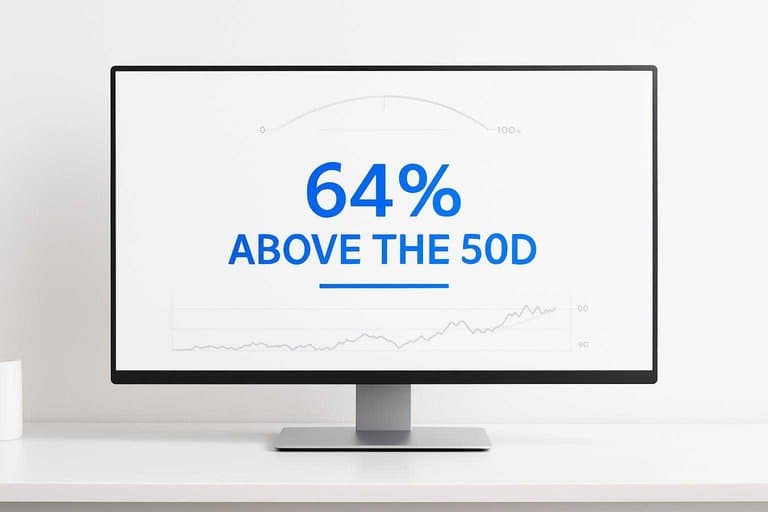
Raw counts lie when your constituent list changes or when you compare markets. Turn counts into percentages so every reading has the same denominator.
Example: “320 stocks above the 50D” becomes “64% above the 50D” if the universe is 500 names. Do the same for new highs, up-volume, or advancing issues.
Percentages make your dashboard portable across time and across indexes.
Smooth the noise
Most daily breadth is mean-reverting because it’s driven by one-day flows and rebalancing. Regimes persist because participation shifts slowly, so you need smoothing that respects both.
Use one of these compressions, based on your timeframe:
- Moving averages (3–10 day) to reduce whipsaws.
- Z-scores (lookback 50–200) to compare to its own history.
- Cumulative lines (AD line, up-down volume) to reveal drift.
If your smoothed series won’t hold direction for a week, it won’t support a swing trade.
Signal archetypes
Breadth signals fall into a few repeatable shapes because crowds move nonlinearly. You’re looking for patterns that either confirm trend fuel or warn of exhaustion.
- Thrusts: sudden participation surge; expect multi-day follow-through.
- Divergences: price up, breadth down; expect failure risk on rallies.
- Deteriorations: slow decay in participation; expect choppy, lower hit-rate trades.
Treat thrusts as permission to press, and treat divergences as a position-sizing problem.
Threshold logic
Hard cutoffs work because traders don’t respond linearly to evidence. At extremes, positioning flips, risk limits hit, and “everyone sees it” becomes forced action.
A 70%+ reading can behave like a different market than 55%, even if the gap looks small. Match thresholds to your holding period, because a day-trader extreme is noise to a 3-week swing.
Pick thresholds that change your behavior, not ones that look pretty on a chart.
Why breadth leads
Diffusion of buying
Breadth moves first because buying spreads before it concentrates in the biggest weights. Think of a fund rotating from “cash to work” into 50 names, not one.
Early on, marginal buyers can lift many mid and small caps a little, flipping advance/decline and % above moving averages. The cap-weighted index barely notices until the same flow reaches mega-caps, or the new highs start clustering in top weights. You see participation before you see points.
Trade the diffusion, not the headline index.
Concentration risk
When fewer names carry returns, the index can look calm while internals get brittle. One chart is strong, while nine drift or fade.
That narrowing leadership raises shock sensitivity because correlations spike under stress. A single heavyweight gap down can drag the index, trigger de-risking, and force selling in unrelated names. That’s the line that gets crossed.
If breadth is thinning, your “safe index” trade is less diversified than you think. See how top-heavy the benchmark can get in the top S&P 500 stocks by weight.
Dealer positioning link
Dealer and systematic flows can move many stocks together before the index prints a clear break. Breadth registers that synchronized push fast.
- Positive gamma dampens intraday swings, keeping participation steadier
- Negative gamma forces hedging, accelerating moves across many names
- Vol-control sells on rising vol, hitting broad baskets at once
- Vol-control buys on falling vol, lifting most stocks together
- Index-option hedges spill into constituents via correlation baskets
When flows go mechanical, breadth becomes your early warning siren.
Volatility regime effect
High-vol regimes compress breadth because dispersion rises and stops get hit more often. More names chop, fewer sustain trends.
Risk-off days cluster, correlations jump, and reversals get violent because positioning is lighter and liquidity is thinner. For swing trades, that changes your math: wider stops, smaller size, shorter hold time, or you get churned. “Normal” time-in-trade stops being normal.
Match your stop and horizon to the regime, not your bias.
A swing-trader workflow
Market state first
You decide risk-on or risk-off before you scan charts. Breadth tells you if the tape is helping or hunting you.
If your dashboard shows expanding advancers, rising percent-above-MAs, and shrinking new lows, you lean into longs. If it shows narrowing participation and new lows spreading, you treat every long as suspect. Example: a pretty breakout in QQQ fails fast when only 30% of stocks are above their 50DMA.
Trade with participation, or you’re just donating stops.
Entry confirmation
Use breadth as your yes/no filter right before you place the order. It keeps you out of “one-index wonders.”
- Confirm advancers improving versus yesterday
- Avoid price up, breadth down divergences
- Check new lows not expanding
- Require equal-weight index holding trend
- Prefer sector breadth supporting your name
When breadth agrees, breakouts follow through more often, and your stop can mean something.
Position sizing
Your size should flex with breadth, not your conviction. Breadth is a clean proxy for correlation and overnight gap risk.
When breadth is strong and broad, winners are less isolated, and gaps tend to be less punitive. You can run closer to full size, or add on constructive pullbacks. When breadth is weak, everything trades like one trade, and bad news hits the whole book.
Size for the market’s connectedness, not your chart pattern.
Exit triggers
You manage exits with the same dashboard you used to get in. The goal is to tighten or hedge before the chart forces you.
- Exit or hedge on breadth rollover across timeframes
- Cut size when new lows expand for 2–3 sessions
- Tighten stops on failed thrust after a breakout
- Reduce exposure on persistent negative divergence
- De-risk when equal-weight loses key support
When breadth breaks first, you get paid for acting early, not for being right.
Dashboard template
You need a single screen that answers one question: risk-on or risk-off for the next 3–10 sessions. Use this layout so every panel has a default lookback and a clear swing decision.
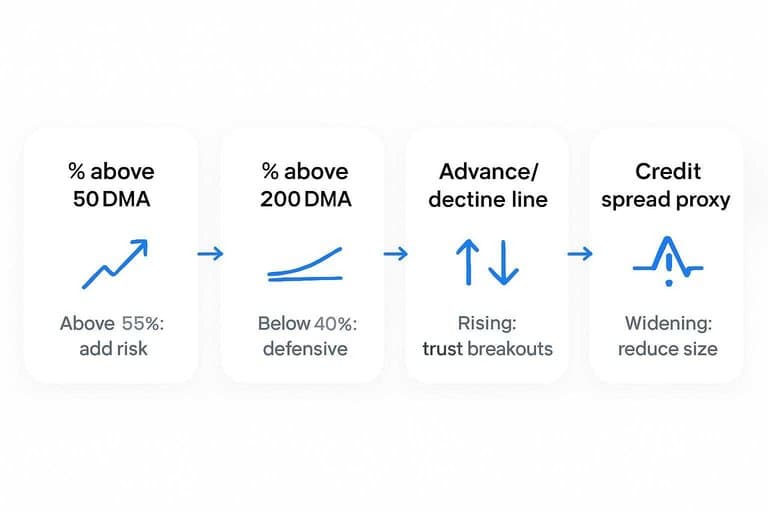
| Panel | Metric | Default lookback | Swing interpretation |
|---|---|---|---|
| Trend | % above 50DMA | 20 days | Above 55%: add risk |
| Trend | % above 200DMA | 60 days | Below 40%: defensive |
| Participation | Advance/decline line | 30 days | Rising: trust breakouts |
| Momentum | New highs minus lows | 20 days | Negative: trim winners |
| Stress | Credit spread proxy | 10 days | Widening: reduce size |
When two panels disagree, trade smaller and wait for alignment.
Common traps
Market breadth feels “wrong” when you expect one number to mirror your watchlist. It won’t, because breadth measures the whole tape, not your favorites.
- Confusing breadth with price direction — breadth tracks participation, not net points.
- Reading one day as a verdict — breadth is noisy inside rebalances and event weeks.
- Mixing universes — NYSE breadth won’t match your Nasdaq growth list.
- Ignoring cap-weighting — mega-caps can lift indexes while breadth fades.
- Treating extremes as reversal signals — strong trends can pin breadth for weeks.
Build your dashboard around one universe and one timeframe, or you’ll diagnose a problem you created.
Mental model: breadth engine
Breadth is your engine check, not your GPS. It measures diffusion and persistence of risk-taking, which shapes swing trend quality and fragility.
Diffusion vs trend
A clean index uptrend can still be brittle if only a few names do the lifting. You want diffusion across many stocks plus persistence above key moving averages.
Think of it like this: “Is the market lifting together, and staying lifted?” When both are true, you can hold winners longer and trim later.
Three dashboard questions
Use the dashboard to answer three questions that drive swing decisions.
- Participation expanding? → % above 50/200DMA panel
- Leadership healthy? → New highs vs new lows panel
- Downside pressure contained? → Net advances / downside volume panel
When two panels agree, your risk sizing gets easier.
What to ignore
One-day anomalies happen because flows, rebalancing, and options hedging can distort internals. A single indicator conflict is common too, like new lows rising while the index holds.
Treat breadth like evidence, not a verdict. Weight clusters over time, then act on your setups.
Put the dashboard to work on your next trade week
Start each week by grading market state with your breadth dashboard (participation, thrust, and leadership) before you look for setups—if breadth is narrowing, treat rallies as lower-quality opportunities. Then use breadth as confirmation: press when multiple measures improve together, and dial size down when signals diverge or thresholds roll over. Finally, let breadth be your early warning system—when participation breaks before price, tighten stops, take partials, or reduce exposure instead of waiting for the index to catch up.
Frequently Asked Questions
Turn Breadth Into Leaders
Building a market breadth dashboard is only half the job—keeping it clean, updated, and tied to a swing-trader workflow is where most traders lose time.
Open Swing Trading delivers daily breadth snapshots, relative strength rankings, and sector/theme rotation context across ~5,000 stocks—so you can shortlist breakout leaders faster. Get 7-day free access with no credit card.