
8 Proven Momentum Trading Strategies for Explosive Gains in 2026
Discover 8 powerful momentum trading strategies you can use in 2025. Learn the rules, indicators, and real examples to capture explosive market moves.
The market doesn't move randomly; it moves in powerful waves driven by institutional capital flowing toward strength and away from weakness. Momentum trading isn't about chasing volatile stocks or trying to predict the future. It's a systematic discipline for identifying where the "big money" is committed and riding that established trend for as long as it lasts. The most profitable traders don't fight the current; they find the strongest one and join it. This is the core principle behind the most effective momentum trading strategies.
This guide cuts through the theoretical noise to deliver a prioritized roundup of eight field-tested momentum frameworks. We will move beyond generic advice and dive into the specific rules, indicators, and chart setups you can use to find and execute high-probability trades. Forget vague tips; you will learn actionable systems for identifying market leaders and managing risk with precision, turning market momentum from an abstract concept into a reliable component of your trading plan.
Each strategy is broken down with a clear focus on practical application. We will cover everything from entry and exit rules to indicator settings and risk sizing, using real trade examples to illustrate the concepts. You'll learn how to implement these techniques, whether you are a swing trader seeking data-driven stock selection or an active trader looking to improve your daily workflow. The goal is to provide a comprehensive playbook that helps you consistently align your capital with the market's most powerful forces. Let's get started.
1. Strategy 1: Relative Strength Index (RSI) Momentum Confirmation
The Relative Strength Index (RSI) momentum confirmation is a foundational strategy for identifying assets with strong directional price movement. Developed by J. Welles Wilder Jr., the RSI measures the speed and magnitude of recent price changes, oscillating between 0 and 100. Traders use this indicator not just for its traditional overbought/oversold signals, but as a direct gauge of momentum strength, making it one of the most reliable momentum trading strategies available.
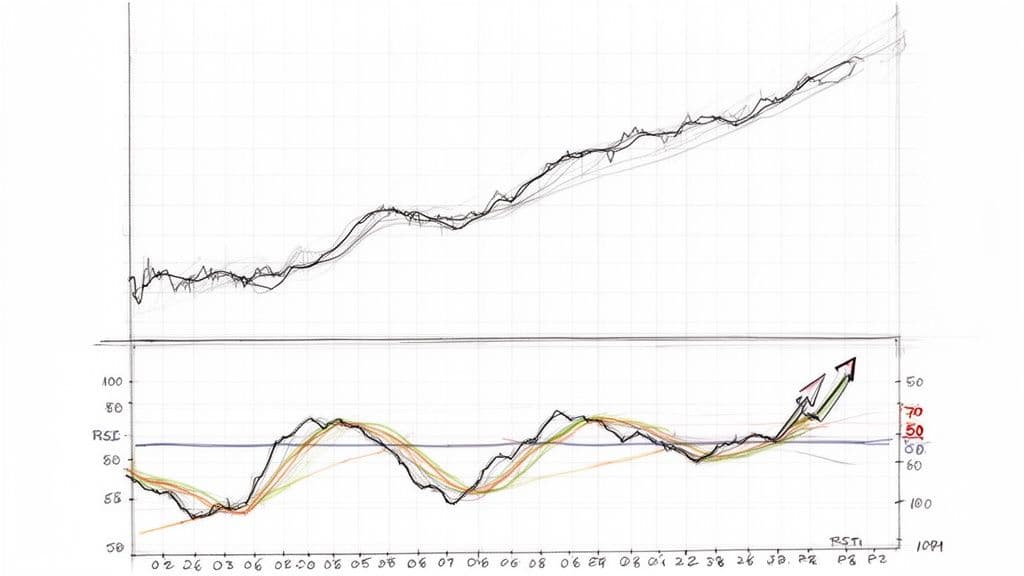
This strategy works by using specific RSI levels to validate a stock's underlying trend. A reading above 50 indicates that upward price movements are stronger than downward movements, confirming bullish momentum. A sustained reading above 60 or 70 signals exceptionally strong momentum, often seen in market leaders just before a major price advance.
How It Works in Practice
The goal is to find stocks that are not just rising, but are rising with conviction. A trader might screen for stocks in a strong sector and then filter for those with an RSI consistently holding above 60. This simple but powerful combination helps isolate true market leaders from the laggards.
For example, during the 2022 energy rally, many oil and gas stocks saw their RSI values climb above 60 and remain there for weeks. Traders using this strategy could have identified these leaders early, entering positions as price confirmed the momentum signaled by the RSI. Similarly, during the 2020-2021 tech boom, semiconductor stocks like NVIDIA frequently registered RSI readings above 70 before significant breakouts, signaling intense buying pressure.
Key Insight: The power of the RSI in momentum trading comes from using it as a confirmation tool rather than a contrarian reversal signal. High RSI readings in a strong uptrend are not a sign to sell; they are a sign of institutional accumulation and robust momentum.
Actionable Tips for Implementation
To effectively integrate this strategy into your trading, follow these specific guidelines:
- Bullish Confirmation: Use an RSI reading above 50 to confirm that a stock is in a valid uptrend. Only consider long positions when the RSI is above this midline.
- Early Momentum Alert: Set alerts on your charting platform for when a stock's RSI crosses above 60. This often serves as an early warning that a stock is gaining significant momentum before it becomes obvious to the broader market.
- Combine with Volume: Always validate RSI signals with volume analysis. A rising RSI accompanied by above-average volume provides much stronger confirmation of buying conviction.
- Use Relative Strength: For superior candidate selection, combine RSI analysis with a relative strength ranking system, like the one offered by OpenSwingTrading. This helps you apply the RSI filter to stocks that are already outperforming the broader market.
2. Breakout Trading on Relative Strength Leaders
Breakout trading on relative strength leaders is one of the most powerful momentum trading strategies, built on the principle that market leaders tend to keep leading. This method involves identifying stocks showing superior price performance relative to the broader market and then entering a position precisely when they break above a key resistance level. By combining relative strength with a classic breakout trigger, traders can pinpoint moments of high conviction and explosive potential.
This strategy works by first filtering the entire market to find the top-performing stocks. Once these leaders are on your watchlist, you wait for a technical breakout, such as a move above a recent high, a consolidation pattern, or a significant moving average. The breakout acts as the catalyst, confirming that buyers are taking control and pushing the stock into a new price discovery phase.
How It Works in Practice
The goal is to trade the strongest stocks at the exact moment their momentum accelerates. Instead of chasing stocks that are already extended, you are positioning yourself for the next leg up as a leader proves its strength. This requires a systematic way to rank stocks and a disciplined approach to execution.
For instance, during the 2023 AI boom, NVIDIA consistently ranked as a top relative strength leader. Traders using this strategy would have placed NVIDIA on their watchlist and waited for it to break out of consolidation patterns. Each breakout was accompanied by a surge in volume, signaling institutional buying and providing a high-probability entry for the next major advance. Similarly, in 2022, energy stocks frequently appeared at the top of relative strength lists, and breakouts above their 50-day moving averages preceded significant uptrends.
Key Insight: This strategy isn't about buying any stock that breaks out; it's about buying breakouts in only the strongest stocks. The relative strength pre-selection dramatically improves the probability of a successful trade by ensuring you are fishing in the most profitable pond.
Actionable Tips for Implementation
To properly execute this strategy, you need a clear, data-driven process:
- Pre-Screen for Leaders: Use a relative strength ranking system, like the one offered by OpenSwingTrading, to screen thousands of stocks daily. This creates a focused watchlist of the top 1-5% of market performers.
- Confirm with Volume: A valid breakout must be accompanied by a significant volume spike, ideally at least 1.5 times the average daily volume. This confirms institutional participation and conviction behind the move.
- Define Breakout Levels: Before the market opens, identify the precise price level that would constitute a breakout for each stock on your watchlist. This prevents emotional decision-making in real-time.
- Manage Risk Tightly: Set your stop loss just below the breakout support level. If the breakout fails and the price falls back below this area, the trade thesis is invalidated, and you should exit to protect capital.
3. Sector Rotation Momentum Strategy
The sector rotation momentum strategy is a macro-level approach that capitalizes on the predictable flow of capital between different market sectors. Instead of picking individual stocks in isolation, this method first identifies which sectors (e.g., Technology, Energy, Healthcare) are showing the strongest relative performance. The core principle is that trading the leading stocks within these hot sectors significantly increases the odds of success, making it one of the most effective momentum trading strategies.

This strategy works by treating sectors as the primary driver of stock performance. Capital rotates between sectors based on economic cycles, geopolitical events, and investor sentiment. By identifying where institutional money is flowing, traders can position themselves in the path of powerful, sector-wide trends.
How It Works in Practice
The goal is to focus your trading capital on the strongest areas of the market and avoid the weakest. A trader using this strategy analyzes sector performance to find which groups are outperforming the S&P 500, then drills down to find the leading stocks within those top-performing sectors.
For instance, during the 2022 energy rally, traders would have noted the outperformance of the Energy sector (XLE) and focused their stock selection on leaders like ExxonMobil or Occidental Petroleum, while avoiding the underperforming Technology sector. Conversely, in 2023, the dominance of the "Magnificent 7" made Technology and Communication Services the clear sectors for momentum traders to concentrate on. This approach aligns your trades with the most powerful underlying market currents.
Key Insight: Individual stock performance is heavily influenced by its sector. By getting the sector trend right first, you create a powerful tailwind for your individual stock picks, dramatically improving your probability of success.
Actionable Tips for Implementation
To effectively integrate this strategy, follow these specific guidelines:
- Focus on Leaders: Concentrate at least 80% of your stock selection within the top 2-3 performing sectors. This ensures your capital is working in the strongest areas of the market.
- Build Sector-Weighted Watchlists: Instead of a random collection of stocks, organize your watchlists by sector. This makes it easier to spot emerging leadership and rotation.
- Monitor Sector Rankings: Use a tool like OpenSwingTrading's sector and industry trend analytics to review daily rankings. This data shows exactly where institutional capital is flowing.
- Anticipate Rotation: Use market breadth indicators, such as the advance/decline line for different sectors, to get early signals of a potential rotation before it becomes obvious on the price charts.
- Define Your Exit: Plan your exit not just based on the individual stock, but also on the sector's momentum. If a leading sector starts to break down or capital rotates into defensive groups like Utilities, it's a signal to reduce exposure.
4. Moving Average Crossover Momentum Strategy
The Moving Average (MA) Crossover is a classic technical analysis tool adapted for momentum trading. It uses the interaction between a short-term (fast) and a long-term (slow) moving average to identify shifts in trend and confirm momentum. When a faster MA, like the 20-day, crosses above a slower MA, such as the 50-day, it signals the start of bullish momentum, often referred to as a "golden cross." This mechanical approach helps filter out market noise and provides clear, objective signals.
This strategy’s power lies in its simplicity and its ability to capture the bulk of major trends. By focusing on the relationship between two different timeframes, it effectively confirms that short-term price strength is beginning to influence the longer-term trend. This dynamic makes it one of the most reliable trend-following momentum trading strategies for both novice and experienced traders.
How It Works in Practice
A trader implementing this strategy would look for stocks where the 20-day MA is decisively crossing above the 50-day MA on a daily chart. This signal indicates that buying pressure is accelerating and a new uptrend may be forming. The goal is to enter a position shortly after the crossover and ride the trend until the MAs cross back in the opposite direction, signaling that momentum is waning.
For instance, during the 2023 tech rally, many leading stocks like Meta Platforms (META) and Amazon (AMZN) generated clear 20/50 MA crossover signals that preceded sustained upward moves. Similarly, in the 2022 energy sector rally, oil producers provided highly profitable crossover signals as crude prices soared. The MA crossover on broad market ETFs like SPY has also historically served as a reliable indicator of major trend reversals, helping traders align with the market's primary direction.
Key Insight: Moving average crossovers serve best as a trend confirmation tool rather than a primary entry trigger. The signal confirms that underlying momentum is shifting, but pairing it with price action or relative strength provides much higher-conviction trade entries.
Actionable Tips for Implementation
To effectively use the MA crossover strategy, consider the following specific actions:
- Confirm with Price and Volume: A crossover signal is much more reliable when the price closes firmly above both moving averages on higher-than-average volume. This confirms institutional conviction behind the move.
- Use Exponential Moving Averages (EMAs): For traders seeking faster signals, EMAs can be more effective than Simple Moving Averages (SMAs). EMAs place more weight on recent price data, making them more responsive to new momentum shifts.
- Combine with Relative Strength: The highest-quality signals come from stocks that are already outperforming the S&P 500. Filter for stocks with strong relative strength first, then apply the MA crossover as a timing confirmation.
- Wait for a Pullback: After a crossover, patient traders can wait for the first minor pullback to the now-rising 20-day or 50-day MA. This often provides a lower-risk entry point with a clearly defined stop-loss level just below the moving average.
5. Institutional Flows and Volume Surge Momentum Trading
This strategy involves "following the big money" by tracking unusual volume surges and order flow patterns to identify where institutional capital is accumulating positions. The core principle is that large institutions like hedge funds and mutual funds cannot hide their activity; their massive orders leave a footprint in the market's volume data. High-volume breakouts and block trades signal significant interest and often precede sustained momentum moves, making this one of the most powerful momentum trading strategies.

This approach works by distinguishing between everyday retail volume and concentrated institutional buying or selling. When a stock breaks out of a price pattern on volume that is two, three, or even ten times its daily average, it's a clear sign that large players are building a position. This institutional demand creates a supply-demand imbalance that can fuel a powerful and lasting trend.
How It Works in Practice
The goal is to pinpoint stocks that are under accumulation by institutions before the full momentum move is underway. A trader would screen for stocks exhibiting abnormal volume spikes, especially on days with strong directional price action. This identifies assets where institutional conviction is high.
For instance, before TSLA's monumental rallies in 2020 and 2021, the stock frequently displayed days of massive volume accumulation as it broke through key resistance levels. Similarly, during the global chip shortage, semiconductor stocks showed concentrated institutional flows as funds rotated into the theme, long before the narrative became mainstream. By monitoring volume, traders could have spotted this institutional interest early and participated in the extended uptrends.
Key Insight: Volume is the fuel for momentum. A price move without a corresponding surge in volume lacks conviction and is more likely to fail. Institutional-driven volume is the most potent catalyst for sustainable trends.
Actionable Tips for Implementation
To effectively integrate this strategy into your trading, focus on identifying these institutional footprints:
- Look for Volume Surges: Set alerts for stocks trading on volume that is at least two times their 50-day average. This is a primary indicator of institutional activity.
- Monitor Sector Accumulation: Institutions often invest thematically. Use tools to track sector-wide capital flows to identify which industries are attracting the most attention.
- Combine with Technical Breakouts: A volume surge is most powerful when it confirms a technical breakout above a key resistance level or from a consolidation pattern. This combination signals high conviction.
- Track Insider and Institutional Filings: Use insider buying reports and 13F filings as supporting evidence. This confirms that the smart money is putting capital to work in the names you are tracking.
6. Thematic and Secular Trend Momentum Strategy
The Thematic and Secular Trend Momentum strategy moves beyond short-term price fluctuations to capture gains from powerful, long-duration societal and technological shifts. This approach identifies major secular themes like the artificial intelligence revolution, the global energy transition, or cybersecurity advancements, and then targets the leading companies within those narratives. It is one of the most durable momentum trading strategies because it aligns trades with deep, multi-year capital flows.
This strategy operates on the principle that market leaders within a powerful theme generate sustained outperformance. Instead of just chasing price, traders combine high-level thematic conviction with technical confirmation, assuming that stocks benefiting from a major trend will exhibit superior relative strength and momentum over extended periods.
How It Works in Practice
The goal is to ride massive waves of innovation and change rather than small, fleeting ripples. A trader first identifies a high-conviction secular trend, such as the AI boom of 2023-2024. They would then screen for companies that are clear beneficiaries and leaders in this space, looking for names like NVIDIA, Microsoft, or Palantir. The final step is to use technical analysis to time entries into these leaders as their momentum accelerates.
For example, observing the multi-year shift toward electric vehicles and renewable energy, a trader could have identified companies like Tesla as a primary beneficiary. Rather than trading it on daily news, they would have held a core position as long as the theme remained intact and the stock continued to outperform the broader market. Similarly, the growing importance of cybersecurity created sustained momentum in stocks like CrowdStrike and Okta, rewarding traders who identified the theme early.
Key Insight: This strategy blends macro-economic analysis with technical momentum. The theme provides the "why" a stock should continue to rise, while technical indicators like relative strength provide the "when" to enter and exit.
Actionable Tips for Implementation
To effectively integrate this powerful strategy, follow these specific guidelines:
- Identify Emerging Themes: Use macro research, industry reports, and thematic analytics tools to pinpoint emerging secular trends before they become widely known. Focus on disruptive technologies and societal shifts.
- Screen for Leaders: Within a chosen theme, screen for stocks exhibiting the highest relative strength against the S&P 500. This isolates the true market leaders from the second-tier players.
- Build Thematic Baskets: Instead of betting on a single stock, consider building a small basket of 2-3 leaders within a theme. This diversifies single-company risk while maintaining concentrated exposure to the trend.
- Time Entries with Breakouts: Use technical breakouts from consolidation patterns or moving average crosses to time your entries. This ensures you are entering when momentum is actively accelerating.
- Quarterly Theme Review: Assess the health and momentum of your themes each quarter. Review earnings calls, institutional reports, and price action to determine if the narrative remains strong or is starting to fade.
7. Mean Reversion Within Uptrends (Dip-Buying Momentum Strategy)
The dip-buying momentum strategy elegantly combines two powerful market concepts: strong directional momentum and short-term mean reversion. Instead of chasing a stock at its peak, this approach identifies market leaders in confirmed uptrends and waits for a temporary, healthy pullback to a key support level. This provides a lower-risk entry point to join an existing, powerful trend, making it one of the most professional momentum trading strategies for managing risk.
This strategy operates on the principle that even the strongest stocks do not move up in a straight line. They experience natural pullbacks as early investors take profits. By buying into this temporary weakness, traders can enter a position with a much more favorable risk/reward ratio, setting a tight stop-loss just below the identified support level.
How It Works in Practice
The core of this strategy is patience. A trader first identifies a stock exhibiting strong relative strength and a clear uptrend, often defined by its price staying above key moving averages like the 20-day or 50-day. Instead of buying the breakout, the trader waits for the price to retreat to one of these moving averages or a previous swing low. The entry is triggered when the price finds support and begins to bounce.
For instance, throughout its historic 2023 rally, NVIDIA (NVDA) frequently pulled back to its 20-day exponential moving average. Each dip provided a high-probability entry for swing traders to rejoin the powerful uptrend. Similarly, pullbacks to the 50-day moving average on the S&P 500 ETF (SPY) during bull markets have historically served as reliable dip-buying opportunities for those aligned with the broader market's momentum.
Key Insight: This strategy transforms the "fear of missing out" (FOMO) into a tactical advantage. By systematically waiting for pullbacks, traders avoid overpaying at the top and instead enter positions at logical points of support where institutional buyers are also likely to step in.
Actionable Tips for Implementation
To effectively execute a dip-buying momentum strategy, precision and discipline are essential:
- Confirm the Uptrend First: Only apply this strategy to stocks in a confirmed uptrend. Use a tool like the OpenSwingTrading ranking system to ensure you are focusing exclusively on market leaders that are outperforming.
- Pre-define Your Levels: Before the dip occurs, identify your target entry zones, such as the 20-day or 50-day moving average, a prior swing low, or a key volume shelf.
- Validate with Market Context: Ensure the pullback is just a stock-specific dip and not the start of a market-wide correction. Check that market breadth and sector momentum remain strong.
- Look for Technical Confluence: The strongest dip-buying signals occur where multiple support levels converge, for example, a 50-day MA that aligns with a horizontal support level and a rising trendline.
- Use Tight Stop-Losses: Place your stop-loss just below the support level you bought at. If the level breaks, the reason for the trade is invalidated, and you can exit with a small, manageable loss.
8. Catalyst-Driven Momentum Trading Strategy
Catalyst-driven momentum trading is an event-focused strategy that positions traders ahead of significant corporate or economic events. These catalysts, such as earnings announcements, FDA drug trial results, or major economic data releases, often create powerful, short-term price movements. Traders use this approach to capture the momentum surge that occurs when the market reacts to new, game-changing information.
This strategy combines fundamental event analysis with technical momentum signals. The core idea is to identify stocks already exhibiting relative strength that also have a major, predictable catalyst on the horizon. By entering before the event, traders aim to capitalize on both the pre-event run-up and the immediate post-announcement reaction, creating an asymmetric risk/reward opportunity.
How It Works in Practice
The goal is to find strong stocks with a defined event that can act as a powerful accelerator for their existing trend. A trader would first identify a list of upcoming catalysts, like an earnings calendar for high-growth tech stocks or an FDA calendar for biotech firms. They would then filter this list for stocks that are already outperforming their sector and the broader market.
For example, a trader might notice a biotech stock with an upcoming PDUFA date (an FDA approval decision) is already breaking out to new highs on strong volume. This combination of a known event and existing momentum signals that institutional players may be positioning for a positive outcome. Similarly, a technology company expected to beat earnings estimates might see its stock climb steadily in the weeks leading up to the report, a classic pre-earnings run.
Key Insight: This strategy isn't about guessing the outcome of a catalyst. It's about trading the momentum that builds in anticipation of the event. The strongest setups occur when a stock’s technical strength aligns perfectly with a scheduled fundamental event.
Actionable Tips for Implementation
To effectively integrate this strategy into your trading, follow these specific guidelines:
- Identify Strong Candidates: Use a relative strength ranking system, like the one from OpenSwingTrading, to screen for stocks that are already market leaders. Only consider catalyst trades in stocks showing top-tier momentum.
- Track Key Calendars: Maintain a calendar of critical events, including earnings reports for your focus list, FDA decision dates, FOMC meetings, and major industry conferences.
- Enter Before the News: The primary opportunity often lies in the price run-up before the catalyst. Enter positions based on technical signals like breakouts or pullbacks to moving averages, but only when a clear event is on the horizon.
- Define Your Exit Plan: A common approach is to sell just before or on the day of the catalyst announcement to lock in profits from the pre-event hype. This avoids the binary risk of a negative surprise.
- Manage Position Size: Catalyst events can be highly volatile. Size your positions smaller than usual to account for the increased risk of a sharp, adverse move if the news is disappointing.
8-Point Momentum Strategy Comparison
| Strategy | Implementation Complexity 🔄 | Resource Requirements ⚡ | Expected Outcomes 📊 | Ideal Use Cases 💡 | Key Advantages ⭐ |
|---|---|---|---|---|---|
| Relative Strength Index (RSI) Momentum Trading | Low — indicator setup and screening; needs confirmation signals | Low — charting platform, RSI & relative strength screener | Timely momentum entry signals; can give false signals in choppy markets | Swing trading in trending markets; pre-breakout scanning | Simple to implement; effective for early breakout entries ⭐⭐⭐ |
| Breakout Trading on Relative Strength Leaders | Moderate — requires ranking + precise breakout identification | Medium — RS rankings, volume data, charting tools | High-probability breakouts when leaders confirm; risk of late entries | Trading top-ranked stocks at new highs; momentum swing trades | Focused on leaders; time-efficient and institutional-aligned ⭐⭐⭐⭐ |
| Sector Rotation Momentum Strategy | Moderate–High — requires macro and sector monitoring | Medium–High — sector analytics, breadth indicators, multiple watchlists | Improved win probability and portfolio context; rotation can be sudden | Portfolio allocation, tactical sector bets, capturing sector tailwinds | Reduces chop; aligns trades with institutional flows ⭐⭐⭐ |
| Moving Average Crossover Momentum Strategy | Low — mechanical rules and clear signals | Low — moving averages, backtesting platform | Clear, rules-based signals but lagging in fast moves; whipsaw in chop | Systematic trend-following and automated strategies | Objective and easy to backtest; provides defined exits ⭐⭐⭐ |
| Institutional Flows & Volume Surge Momentum Trading | High — real-time order-flow interpretation and nuance | High — real-time volume/order-flow data, premium feeds | Early detection of sustained moves when institutional interest is present | Short-term momentum entries anticipating institutional accumulation | Signals potential sustained trends early; aligns with capital flows ⭐⭐⭐⭐ |
| Thematic & Secular Trend Momentum Strategy | High — theme identification + fundamental and technical research | Medium–High — thematic analytics, industry research, long horizon | Potential multi-year outperformance when themes persist; requires patience | Long-term thematic investing and sector leadership plays | High-conviction, long-duration trades aligned with secular tailwinds ⭐⭐⭐ |
| Mean Reversion Within Uptrends (Dip-Buying) | Moderate — needs reliable trend confirmation and timing | Medium — trend tools, quick execution, watchlists | Improved risk/reward on entries; vulnerable if dip becomes reversal | Buying pullbacks in confirmed uptrends; swing entries with defined stops | Better entry prices and precise stops; high win-rate in strong trends ⭐⭐⭐ |
| Catalyst-Driven Momentum Trading Strategy | High — event research and timing precision required | Medium–High — catalyst calendars, event research, options (optional) | Asymmetric short-term returns around events; outcomes binary and high-volatility | Short-term trades around earnings, FDA decisions, M&A, economic data | Can produce explosive moves and defined risk around events ⭐⭐⭐ |
From Strategy to Execution: Your Next Steps in Momentum Trading
We have journeyed through a comprehensive toolkit of eight powerful momentum trading strategies, each offering a unique lens through which to view and capitalize on market strength. From the pure price velocity captured by RSI and MA Crossovers to the nuanced, context-driven approaches of Sector Rotation and Catalyst-Driven moves, the common thread is clear: successful trading is about aligning with the market's dominant force. The goal isn't to randomly pick one method and hope it works forever. The real skill lies in building a dynamic system.
The true art of momentum trading is knowing which strategy to deploy and when. A Breakout strategy on relative strength leaders thrives in a healthy, bullish market with broad participation. Conversely, a Mean Reversion approach to dip-buying is more effective when the market is pulling back within a confirmed uptrend. Chasing institutional flows becomes paramount during earnings season, while thematic strategies can provide alpha for months or even years as a new technology or economic shift takes hold.
Your task now is to move from theory to a personalized, systematic application. Resisting the urge to become a "jack of all trades" is critical. Instead, focus on becoming a master of a few select methods that resonate with your personality, risk tolerance, and available screen time.
Synthesizing Your Momentum Trading Framework
The strategies discussed are not mutually exclusive; they are complementary pieces of a larger puzzle. A powerful trade setup often exhibits signals from multiple strategies simultaneously, creating a confluence of evidence that increases its probability of success.
Imagine a stock that meets the following criteria:
- Relative Strength Leader: It's outperforming 95% of the market.
- Sector Strength: It belongs to the top-performing sector of the last quarter.
- MA Crossover: Its 20-day EMA has recently crossed above its 50-day EMA, confirming short-term acceleration.
- Volume Surge: It just broke out of a multi-week consolidation base on a massive volume spike, signaling institutional accumulation.
This is no longer just a simple breakout. It is a high-conviction setup validated by four distinct momentum principles. This is the level of synergy you should aim to identify.
Your Actionable Path Forward
To translate this knowledge into tangible results, you need a disciplined process. Here are your next steps:
- Select and Specialize: Choose two or three momentum trading strategies from this article that best fit your style. A swing trader might combine Breakouts and Dip-Buying, while a position trader might focus on Sector Rotation and Thematic trends.
- Define Your Rules: For your chosen strategies, write down explicit, non-negotiable rules for entry, exit (for both profit and loss), and position sizing. For example: "I will only enter a breakout trade if the stock is above its rising 20-day EMA and the breakout occurs on at least 2x average daily volume."
- Backtest and Journal: Go back in time on the charts. Manually backtest your rules across different market conditions (bull, bear, sideways). Document your findings in a trading journal to identify patterns in your execution and refine your system.
- Embrace Market Context: The most crucial step is to stop analyzing stocks in a vacuum. Before every trading day, assess the broader market health. Is the S&P 500 above its key moving averages? Are more stocks advancing than declining? This context will dictate whether you should be aggressive (deploying capital) or defensive (preserving capital).
Mastering these momentum trading strategies is a journey of continuous refinement. It’s about building a robust, repeatable process that removes emotion and guesswork, replacing them with data-driven conviction. By understanding the underlying market forces and knowing which tool to use for the job, you empower yourself to consistently position your portfolio on the right side of market momentum.
Ready to stop guessing and start leveraging data-driven market context? OpenSwingTrading provides the daily signals and analysis you need, including market health indicators, sector rotation dashboards, and curated watchlists of relative strength leaders. Integrate our professional-grade insights into your daily routine in just 5-15 minutes by visiting OpenSwingTrading.