A Swing Trader's Guide to the Negative PE Ratio
What does a negative PE ratio mean for your trades? Learn to analyze unprofitable stocks, find hidden momentum leaders, and turn this metric into a unique edge.
A negative PE ratio isn't some complex financial voodoo. It's a straightforward signal that a company lost money over the last 12 months.
Since you can't logically divide a positive stock price by a negative number (the earnings), the PE ratio becomes meaningless. That's why you'll often see it displayed as "N/A" on stock screeners. For active traders, this isn't a glitch; it's a critical piece of information about the stock's fundamental health.
What a Negative PE Ratio Really Means for Traders
When you see a stock with a negative PE, it just means the "E" (Earnings) in the Price-to-Earnings formula is a negative number. Think of it like a local coffee shop that spent more on beans, rent, and staff than it brought in from selling lattes. You can't calculate a profit multiple on a loss.
For swing traders, this completely changes the game. A stock with positive earnings is typically judged on its stability, profitability, and predictable growth. A stock with negative earnings, however, is a different beast entirely.
These companies are valued not on what they're doing right now, but on their perceived future potential. The market narrative—the story—becomes the single biggest driver of its price. This creates exactly the kind of environment ripe with volatility and momentum that swing traders are looking for.
The Swing Trader's Perspective
From a practical, in-the-trenches trading standpoint, a negative PE tells you a few key things right away. Getting a handle on these is the first step toward finding solid opportunities where others only see a red flag. The ability to identify these scenarios is a key benefit of swing trading, allowing you to capitalize on short-to-medium term sentiment shifts that fundamental investors often miss.
Here's what it usually implies:
- Higher Volatility: Unprofitable companies are famous for wild price swings. Their stock prices react much more dramatically to news, industry hype, and general market sentiment. This volatility is a double-edged sword, offering huge potential gains but demanding rock-solid risk management.
- Narrative-Driven Price Action: The story is everything. A groundbreaking new technology, a rumored buyout, a major turnaround plan—these narratives matter far more than the current balance sheet. The price is fueled by speculation and belief in what the company could become, not what it is.
- Detachment from Traditional Valuation: Forget the old-school valuation playbooks. They just don't apply here. This is precisely why many fundamental, value-focused investors won't touch these stocks, which creates a unique opening for traders who focus on price action and momentum.
As we’ve seen throughout early 2026, stocks with negative earnings have frequently outperformed their profitable counterparts. This trend underscores a critical lesson for traders: momentum can, and often does, diverge from traditional measures of corporate health.
Let's break down the practical differences in how a swing trader might approach these two types of companies.
Positive PE vs Negative PE: A Swing Trader's View
This table offers a comparative look at the key characteristics and trading implications of stocks with positive versus negative PE ratios.
| Characteristic | Positive PE Ratio (Profitable Companies) | Negative PE Ratio (Unprofitable Companies) |
|---|---|---|
| Primary Driver | Earnings growth, stability, and fundamental strength. | Future potential, narrative, speculation, and market hype. |
| Volatility | Generally lower and more predictable price action. | Typically higher, with sharper, more frequent price swings. |
| Trading Strategy | Often focuses on breakouts from established ranges, earnings beats, and pullbacks to key support levels. | Focuses on capturing strong momentum, news-driven catalysts, and trend continuation. Requires tighter risk control. |
| Risk Profile | Lower fundamental risk but potentially slower moves. | Higher fundamental risk (risk of failure) but potential for explosive, rapid gains. |
| Analysis Focus | Blends technical analysis with fundamental valuation metrics (e.g., PE, PEG ratio). | Heavily reliant on technical analysis, price action, volume, and understanding the market story. |
Ultimately, neither is inherently "better"—they just represent different kinds of trading opportunities that demand different strategies.
The Core Challenge and Opportunity
The real challenge is learning to tell the difference between a company on the verge of a massive breakthrough and one that's just burning through cash on its way to zero. If you simply write off all unprofitable companies, you'll miss out on some of the market's most explosive movers.
This guide will give you a clear framework for navigating this landscape. We're going to move past the simple definition of a negative PE and dig into how to actually analyze these unique stocks. You'll learn how to figure out why a company is unprofitable, screen for the ones with real momentum, and use alternative tools to get a better read on them.
By integrating these ideas into a data-driven workflow like the one we use at OpenSwingTrading, you can turn what looks like a financial red flag into a real strategic advantage. You’ll be able to spot high-potential trades that most of the market completely overlooks. The goal is to trade what's actually happening with the stock's price, not what traditional valuation says should be happening.
Why Good Companies Sometimes Have Negative Earnings
A negative P/E ratio can feel like a red flag, and sometimes it is. But for a swing trader, it's rarely a "sell" signal on its own. The real question isn't if a company is losing money, but why. Getting to the bottom of that story is what separates a savvy trade from a blind bet.
Some of the most powerful market moves come from companies that are unprofitable for very strategic, and even bullish, reasons. Your job is to tell the difference between a company investing in its own explosive future and one that's simply circling the drain. The context behind the numbers is everything.
Aggressive Growth and Reinvestment
This is the classic story for a negative P/E, and often the most exciting one. We see it all the time with disruptive tech companies or biotech firms pushing the boundaries of science. These companies are in a full-on sprint, a land-grab phase where capturing market share and building a moat is far more important than turning a profit this quarter.
Every dollar they make, plus a heap of investor cash, gets plowed right back into the business. They're not just burning cash; they're investing it in:
- Research & Development (R&D): Pouring money into the next big thing that could dominate their industry for years to come.
- Sales & Marketing: Spending whatever it takes to get their name out there, acquire customers, and become the default choice before the competition even gets its shoes on.
- Scaling Infrastructure: Building the factories, data centers, and logistics to handle the massive growth they're anticipating.
For these companies, profitability isn't an accident—it's a dial they've intentionally turned down to zero in favor of growth. They're playing the long game. As a swing trader, if you can spot one of these growth stories before the rest of the market catches on, you're positioning yourself for a potentially explosive ride as the narrative shifts from "they're losing money" to "look at this growth!"
Cyclical Downturns in Strong Businesses
Sometimes, a perfectly good company gets dragged into the red by forces outside its control. Think about industries whose fortunes rise and fall with the broader economy—industrial manufacturing, energy, homebuilding. When the economy slows down or their specific sector hits a rough patch, demand can evaporate, pushing even the best-run companies into a temporary loss.
Imagine an industrial machinery company that sees its order book dry up during a manufacturing slump in early 2026. It might post a quarter or two of negative earnings, scaring off less-experienced investors. But a seasoned trader sees this differently.
When you see a cyclical company with a negative P/E, the question isn't "Are they profitable now?" It's "Do they have the cash and market position to ride out the storm and come out stronger on the other side?"
The trick here is to look for signs that the cycle is hitting bottom. A swing trader using a platform like OpenSwingTrading might notice big money starting to flow back into these beaten-down sectors. That's a huge tell—a leading indicator that the market expects a recovery, giving you a chance to get in long before the positive earnings headlines return.
Turnarounds and Strategic Restructuring
Finally, a company might be losing money because it's in the middle of a massive overhaul. This could be an older company selling off its dead-weight divisions, a retailer pivoting to a new online model, or a business absorbing the short-term costs of a game-changing acquisition.
These periods are messy. The headlines are often bad, and the negative earnings can send retail investors running for the hills. But this is exactly where incredible opportunities hide. A successful restructuring can forge a leaner, meaner, and far more profitable company from the ashes of the old one.
For the swing trader, the signal isn't the earnings report; it's the market's reaction to the plan. Is the stock price starting to carve out a solid base after a long downtrend? Is volume picking up on green days? These technical clues, layered on top of the fundamental story of a turnaround, tell you when the market is starting to believe again. Your trade is about capturing that shift in sentiment as the company claws its way back from red to black.
How to Screen for High-Momentum Unprofitable Stocks
Let's be honest, most stock screeners are built for the value investing crowd. They're designed to find cheap, stable, and profitable companies. The moment a company shows a negative PE ratio, it gets tossed out like a bad apple.
For a swing trader, this is a huge blind spot. Some of the most explosive breakout moves come from companies that are currently unprofitable. If your screener is automatically filtering them out, you're leaving serious money on the table.
To find these hidden gems, you have to completely flip your screening process. Stop looking for low P/E ratios or perfect balance sheets. Instead, we need to focus on the two things that actually drive powerful, short-term moves: price momentum and relative strength.
The goal here isn't to find bad companies. It's to find the "best of the worst"—unprofitable companies showing clear signs of institutional buying, putting them on the verge of a major trend reversal or a massive acceleration. This is where a swing trader finds their edge.
Building Your Momentum-First Screen
Instead of leading with fundamentals, we’re going to lead with technicals. Your first filter should be all about finding stocks that are already flexing their muscles and outperforming the market. You're looking for price action so compelling that it practically begs you to dig deeper and figure out what’s going on.
Here’s a simple, no-nonsense way to build this initial screen:
- Set a Minimum Price: Start by filtering out the junk. I like to set a minimum of $10 per share to avoid the wild west of penny stocks.
- Ensure Liquidity: You need to be able to get in and out cleanly. Add a filter for average daily volume—something like over 500,000 shares is a good starting point.
- Prioritize Relative Strength: This is the secret sauce. Filter for stocks with a high relative strength (RS) rating. Look for an RS score above 80 or 90, which tells you the stock is already beating most of the market.
- Confirm the Trend: Finally, make sure the stock is actually in an uptrend. A simple way to do this is to add a rule that the price must be above a key moving average, like the 50-day or 200-day.
This first pass gives you a clean list of the market's technical leaders, completely ignoring whether they're profitable or not. This is your hunting ground for high-potential, negative-P/E stocks.
Analyzing the 'Best of the Worst'
Now you have a curated list of strong performers. Institutions are likely piling into these names, and your job is to figure out why. It's time to sift through this list and find the unprofitable companies that have a story worth betting on.
This is where a platform like OpenSwingTrading comes in handy. Its daily rankings are built around momentum, so you can quickly spot which unprofitable stocks are climbing the ladder.
This entire process is about understanding that a company’s financial journey isn't always a straight line. Periods of unprofitability can come from aggressive growth, a cyclical downturn, or a major restructuring.
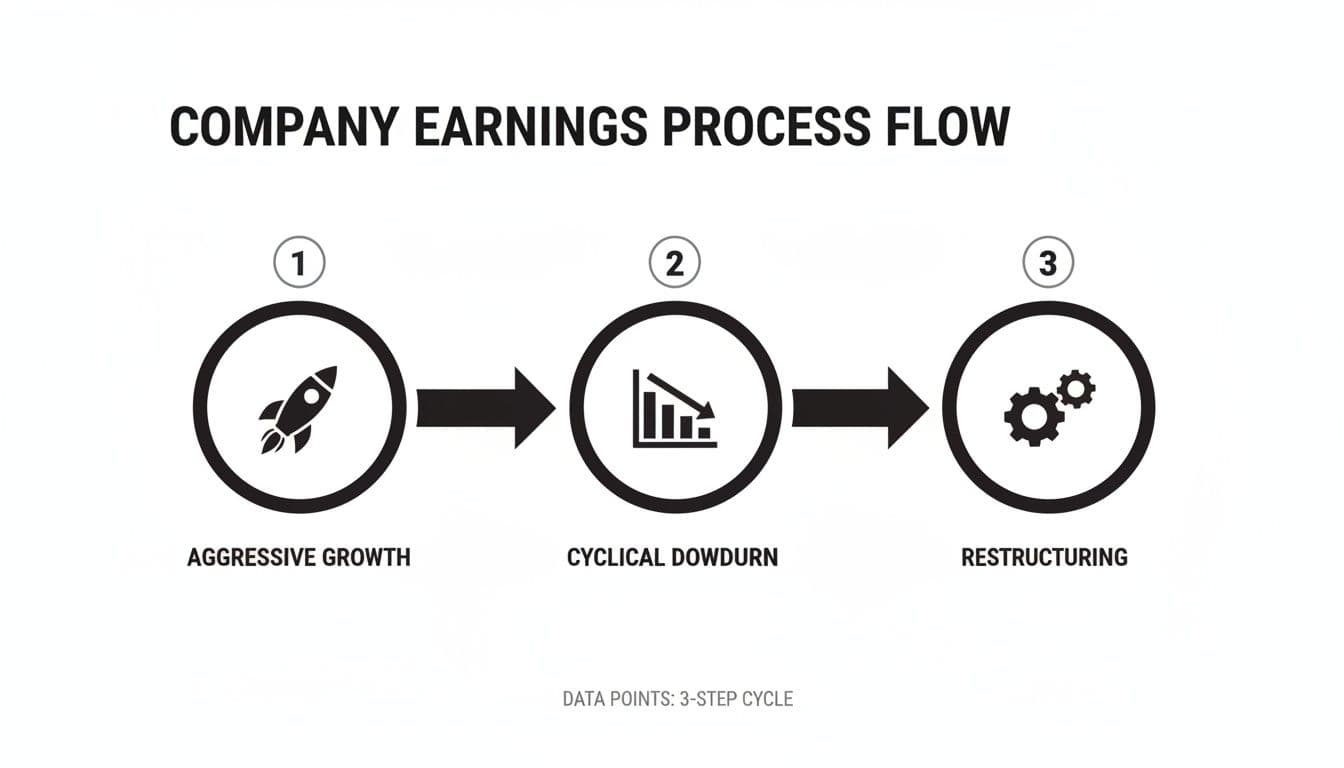
The image above illustrates these pathways perfectly. A spell of red ink isn't always a death sentence; sometimes, it’s a necessary step toward something much bigger.
For us swing traders, seeing these stocks pop up on a momentum scan is a signal of both higher risk and potentially massive rewards. According to the standard Price-to-Earnings valuation framework, these companies fall into a black hole where traditional analysis breaks down. As you can learn more about on worldperatio.com, companies that dip into negative earnings often experience wild price swings, which can be brutal for traders who rely solely on relative strength.
By screening for momentum first, you let the market tell you which unprofitable companies matter. You are reacting to institutional demand rather than trying to predict it, giving you a powerful edge.
This approach puts you in a position to spot breakout candidates long before they show up on everyone else's radar. You're not waiting for a positive earnings report to tell you a stock is a buy. You're trading on the market's growing belief in the company's future—a far more potent signal for swing trading.
Valuation Tools to Use When P/E Is Useless
When a company has a negative P/E ratio, the most common tool in an investor's kit is off the table. It's like trying to navigate with a compass that just spins in circles—the reading is meaningless. But for a swing trader focused on momentum, this isn’t a dead end. It's just a signal to reach for a different set of tools in your toolbox.
Since you can't measure an unprofitable company by its earnings, you have to look at what's driving the business instead. These alternative metrics help piece together the real story behind the stock's price action.
Price-to-Sales Ratio: The Go-To for Growth
The first place I almost always look is the Price-to-Sales (P/S) ratio. This metric compares a company's market cap to its total revenue. Think of it this way: P/E is like judging a new restaurant on its profit after its first month—it might be negative because of startup costs. P/S is like judging it on how many customers are walking in the door and buying food. It measures traction.
For a young, high-growth company, sales tell a much better story than profits. The company might be burning cash on purpose—investing heavily in marketing, research, and development—but if revenue is soaring, you know they've found a product that people want.
As a swing trader, a falling P/S ratio paired with accelerating sales growth is a beautiful thing. It suggests the stock is getting cheaper relative to its actual business growth, often just before the rest of the market catches on. This is a classic setup for a momentum trade, where improving fundamentals start lighting a fire under the stock price.
Price-to-Book Ratio: Valuing the Assets
While P/S is king for growth stories, the Price-to-Book (P/B) ratio is my go-to for asset-heavy businesses. This metric stacks up the company's market cap against its book value—essentially, what would be left if you sold off all its assets (factories, inventory, real estate) and paid off all its debts.
The P/B ratio answers a simple question: What are the company's tangible assets actually worth? It’s incredibly handy for industrial, financial, or even utility companies that might be caught in a temporary downturn. A low P/B can signal that the stock is trading for less than the value of its physical stuff.
For a swing trader, seeing a stock with a low P/B ratio start to show signs of life (like outperforming the market) can be a powerful clue that a turnaround is underway. It often means big money is starting to buy into the company's tangible value before the positive earnings even show up.
This mix of deep value and emerging momentum can give you a solid foundation for a trade, providing a logical reason to get in even while the P/E ratio is still negative.
Forward-Looking Metrics: Revenue Growth and Estimates
At the end of the day, the stock market is a forward-looking machine. Past performance is one thing, but what really moves a stock is what investors think will happen next. For unprofitable companies, two forward-looking indicators are absolutely critical.
- Revenue Growth Rate: How fast are sales growing? I’m looking for acceleration here—is the growth rate picking up steam quarter-over-quarter and year-over-year? For a stock with negative earnings, strong revenue growth is the fuel.
- Forward Earnings Estimates: What are Wall Street analysts expecting? A company might be losing money today, but if the consensus is that it will hit profitability in the next few quarters, the stock will start moving up long before that happens.
In 2026, where the market story can change on a dime, these forward-looking data points are your headlights. They help you decide if the hype around a company is backed by a real path to future success.
With the P/E ratio being unusable for a huge swath of the market, knowing which alternative metrics to turn to is essential. These tools help you look beyond the bottom-line number and see the underlying health and potential of a business.
The table below breaks down the key metrics we've discussed and a few others that are helpful for analyzing companies that aren't yet profitable.
Alternative Metrics For Analyzing Unprofitable Companies
| Metric | What It Measures | Best For Companies That Are... | A Swing Trader Should Watch For... |
|---|---|---|---|
| Price-to-Sales (P/S) | Market cap relative to total annual revenue. | High-growth, pre-profitability (tech, biotech). | A low or declining P/S ratio combined with accelerating revenue growth. |
| Price-to-Book (P/B) | Market cap relative to the company's net asset value. | Asset-heavy (industrials, financials, utilities). | A low P/B ratio (e.g., under 1.5) followed by technical signs of a bottom. |
| Enterprise Value / Sales (EV/Sales) | Enterprise value relative to revenue. A more complete version of P/S. | Businesses with significant debt or cash. | A declining EV/Sales ratio, as it accounts for changes in the balance sheet. |
| Revenue Growth Rate | The percentage increase in revenue over a period (QoQ, YoY). | All unprofitable companies, especially in growth sectors. | Strong, accelerating growth. A company growing at 50% is better than one growing at 20%. |
| Gross Margin | The percentage of revenue left after accounting for the cost of goods sold. | Early-stage companies with a scalable business model. | High and stable (or improving) gross margins, which indicate future profit potential. |
By adding these tools to your analytical process, you can confidently evaluate any company, profitable or not. This opens up a whole new universe of high-momentum trading opportunities that many traditional investors will completely overlook.
Managing the Hidden Risks of Negative PE Stocks

Let's be clear: trading stocks with a negative PE ratio can deliver incredible returns. But ignoring the risks that come with them is a fast track to a zeroed-out account. The potential for explosive gains is directly tied to elevated danger, and smart risk management is what turns a calculated speculation into a winning strategy, not just a reckless gamble.
This isn't just about the long-term risk of a company going under. For swing traders, the dangers are much more immediate. These stocks are known for their wild volatility, wider bid-ask spreads that eat into your profits, and a hair-trigger reaction to just about any news.
Unprofitable growth stocks are especially sensitive to bigger economic currents. We saw this play out throughout 2026, as these names reacted violently to even minor shifts in overall market sentiment.
Capital Protection Techniques
Protecting your capital is about more than just dodging losses—it's about staying in the game long enough for your best ideas to pay off. This demands a disciplined, rules-based approach that respects the unique, often chaotic, behavior of unprofitable stocks.
Here are a few practical techniques every swing trader should have in their toolkit:
- Control Position Size: This is your first and most important line of defense. Taking smaller-than-usual positions on these trades means no single loss can devastate your portfolio. A 50% drop on a 1% position is a scratch; the same drop on a 10% position is a catastrophe.
- Widen Your Stop-Losses: These stocks are volatile. If your stops are too tight, you'll get shaken out of perfectly good trades. You need to give the stock room to breathe by setting a wider initial stop-loss. The key is to balance this by reducing your position size, so your total dollar risk per trade stays consistent.
- Confirm with Volume: Price shows you what is happening, but volume tells you how much conviction is behind the move. I never enter a breakout on a negative PE stock unless I see a massive surge in volume. That's my confirmation that big players are getting interested.
These ideas are the bedrock of any solid trading plan. Your goal isn't to eliminate the chaos—it's to manage it, turning that volatility into an edge instead of a liability.
Macroeconomic Awareness in 2026
The broader market environment has an outsized impact on speculative stocks. When institutional money is flowing freely, it lifts all boats, even the unprofitable ones. But when investors get nervous and pull back on risk, these are the first stocks they dump.
For instance, from 2022 to 2024, private equity fundraising dropped for three consecutive years, and global real estate funds saw negative returns. This was a direct result of rising interest rates and inflation, which sent investors running from riskier assets. As you can learn more about these private markets trends, these large-scale shifts dictate where capital flows. For a swing trader, paying attention to this context is non-negotiable.
The core principle of OpenSwingTrading is discipline. The market will always dangle tempting, high-risk setups in front of you. Having a concrete risk management plan is what ensures you can capitalize on them without taking on catastrophic risk.
By understanding the specific risks of a negative PE stock and sticking to a strict set of rules, you can trade these high-momentum names with confidence. This disciplined approach lets you tap into some of the market's most powerful moves while keeping your downside firmly under control.
Tying It All Together: A Practical Trading Workflow
Knowing the theory is one thing, but having a repeatable process is what actually makes you money. Let's take everything we've covered about the negative P/E ratio and build a practical, step-by-step workflow you can actually use every day. The goal here is simple: build smarter watchlists and find the confidence to trade those high-momentum setups that most people shy away from.
This isn't about throwing darts. It's a structured way to zero in on stocks with explosive potential, even when the usual metrics don't apply. By layering market health, sector strength, and individual stock analysis, we can create a solid framework for finding and managing these unique trades.
Step 1: Get a Read on the Market's Mood
Before you even glance at a single stock, you need to know what kind of market you're dealing with. Speculative growth stocks—especially those with no earnings—live and die by the market's appetite for risk. They absolutely thrive in a "risk-on" environment where big investors are willing to bet on future growth.
For us in 2026, this has been a non-negotiable first step. A quick daily check tells you whether to press the gas or tap the brakes:
- Check the Majors: Are the S&P 500 and Nasdaq trading above their key moving averages, like the 21-day and 50-day? A solid uptrend acts like a tailwind for everything else.
- Look Under the Hood: Is the rally for real? Market breadth tools can show you if a move is broad-based or just a few mega-caps dragging the market higher. You want to see widespread participation.
If the market is a mess or in a clear downtrend, stay defensive. Unprofitable companies are almost always the first to get dumped when fear takes over.
Step 2: Follow the Big Money
Okay, the market looks healthy. Now what? The next question is, "Where is the big money flowing?" This is where you put on your detective hat and look for institutional footprints. Big funds move in herds, and their massive capital flows are what create the powerful trends we, as swing traders, want to ride.
A platform like OpenSwingTrading makes this dead simple by ranking sector strength daily. You’re looking for sectors that are breaking out or clearly leading the pack. This is your hunting ground.
Think about it: a company with a negative P/E in a red-hot sector is a world away from one languishing in a forgotten industry. The sector's momentum provides critical context and can lift all the boats within it.
By figuring out where institutional capital is moving first, you’re basically positioning yourself to catch the start of a major wave. A strong sector can make even fundamentally shaky stocks look like superstars, creating incredible swing trading opportunities.
Step 3: Execute the Negative P/E Playbook
Now that you've got a healthy market and a hot sector, it's time to zoom in on individual stocks. When your momentum scans spit out a company with a negative P/E, this is where you apply the specific rules we've been talking about.
- Find the "Why": Dig into the story. Is the company losing money because it's pouring cash into hyper-growth, weathering a temporary downturn, or in the middle of a messy turnaround? The narrative matters.
- Switch to Alternative Metrics: Forget P/E for a moment. Pull up the Price-to-Sales (P/S) ratio and check out the revenue growth. Is revenue accelerating? That’s your confirmation that the business itself has momentum.
- Get Serious About Risk: This is non-negotiable. Use smaller position sizes and give your stop-losses a bit more room to breathe. These stocks are wild, and you have to be prepared for the volatility.
A negative P/E ratio simply means a company has reported a loss, which makes this classic metric useless in most databases. This is a huge challenge for traders because these stocks lack that traditional earnings anchor, making them incredibly volatile. You can get a deeper understanding of the mechanics of the Price-to-Earnings ratio to see why this forces a different approach. This workflow is designed to turn that very challenge into a structured, manageable opportunity.
Answering Your Top Questions About Negative PE Ratios
Alright, let's wrap this up by hitting some of the most common questions I hear from traders about negative P/E ratios. Think of this as a quick debrief to lock in these ideas so you can act with confidence when you see one in the wild.
Is a Negative PE Ratio Always a Bad Sign?
Not a chance. Sure, it tells you the company isn't profitable right now, but that’s just the start of the story. The real question is why it’s losing money.
Sometimes, it's a genuine red flag signaling a business in deep trouble. But other times, it’s a massive green light—a sign that a high-growth company is pouring every dollar back into capturing market share and building something huge. For a swing trader, context is king. A negative PE ratio on a stock that's already outperforming the market isn't a "sell" signal; it's a signal to start digging.
Can a Stock Price Really Go Up If The Company Is Losing Money?
Absolutely. In fact, some of the most explosive moves we've seen in 2026 came from companies deep in the red. You have to remember that the stock market is a forward-looking machine. It doesn't just price in what a company earned last quarter; it prices in what investors believe it will earn years from now.
If the market buys into a company's vision—whether it's disruptive tech, a brilliant turnaround plan, or just mind-blowing revenue growth—the stock can take off long before profitability is even on the horizon. This is the bedrock principle of momentum trading.
How Does This Fit into an OpenSwingTrading Workflow?
This is where a system like OpenSwingTrading really shines. It helps you sidestep the noise of a useless metric like P/E and focus on what's actually driving the stock: momentum and relative strength.
Instead of getting tripped up by traditional valuation, the workflow keeps you on track:
- Check the Market's Pulse: First, you confirm whether the overall market is even friendly to more speculative, high-growth names.
- Find Where the Money Is Going: Next, you identify which sectors are attracting big institutional buying.
- Pinpoint the Leaders: Finally, you zero in on the stocks showing the most powerful momentum, regardless of their earnings.
This simple, repeatable process helps you uncover strong, unprofitable companies that old-school value screeners would filter out immediately. It gives you a real edge because you’re trading what the market is actually doing, not what some textbook says it should be doing.
Ready to stop missing out on the market's strongest momentum stocks? OpenSwingTrading provides the data-driven clarity you need to assess the market, find leading sectors, and build a watchlist of high-potential breakout candidates in just 15 minutes a day. Start your free trial at https://openswingtrading.com and trade with a new level of confidence.