Mastering Price Action Trading for Modern Swing Traders
A practical guide to price action trading. Learn to read market stories, identify high-probability setups, and use data to gain a real edge in swing trading.
Price action trading is all about making your decisions directly from a clean price chart. No lagging indicators, no complex overlays—just the raw movement of price. You're analyzing the history of how a stock has moved to get a feel for where it's likely headed next. For swing traders navigating the markets in 2026, this skill is absolutely essential. By focusing on pure price movements, swing traders can often react faster and with more clarity, capturing multi-day or multi-week moves with less noise and complexity.
What Is Price Action Trading and Why It Still Matters
Think of it this way: would you rather get a second-hand summary of a conversation or hear it yourself? Indicators are like that summary—they're just derivatives of price, telling you what already happened, often with a delay. Price action trading is about listening to the conversation directly from the source. You're learning the language of the market as it's spoken on the chart.
This is what traders mean when they talk about trading a "naked chart." It’s not about memorizing dozens of obscure patterns. It’s about reading the unfolding story of supply and demand, which gives swing traders a massive edge in clarity and confidence. This direct approach allows for a less stressful, more patient trading style, as you're not constantly reacting to flashing indicators but waiting for clear, logical setups to form over several days.
The Core Philosophy of Price Action
The core belief here is simple: everything you need to know is already baked into the price. Economic reports, news headlines, earnings surprises—all of it is filtered through the emotions and decisions of millions of traders and shows up as price movement. That makes price action the purest signal you can get.
A swing trader who masters this approach focuses on just a few key things:
- Market Structure: Are we in an uptrend, a downtrend, or just chopping sideways? Identifying the overall market flow is step one.
- Key Levels: These are the battlegrounds—the support and resistance zones where buyers and sellers have historically duked it out.
- Candlestick Patterns: Individual candles and small clusters tell you a story about market sentiment right now. Are buyers in control, or are sellers taking over?
Price action isn't about gazing into a crystal ball. It’s about spotting high-probability setups where the potential reward heavily outweighs the risk. It teaches you to react to what the market is doing, not what you think it should be doing.
A Timeless Skill for Modern Markets
This isn't some new-fangled strategy. The roots of price action go all the way back to 17th-century Japan, where a legendary rice trader named Munehisa Homma developed candlestick charting. Steve Nison brought these powerful techniques to the West in the 1990s, and they've been a staple ever since.
Today, its influence is undeniable. Over 70% of retail forex traders lean on candlestick patterns, and price action is a leading strategy on major platforms, with around 40% of swing traders focusing on these raw patterns to catch breakouts. You can learn more about the fascinating history and impact of price action trading.
Learning to Read the Market's Story

If you want to get good at price action trading, you first have to learn how to read what the market is telling you right from the chart. It's about breaking down price movement into its core components, and it all begins with the humble candlestick.
Think of each candle not just as a red or green bar, but as a mini-story of a single trading period. It’s a blow-by-blow account of the battle between buyers (bulls) and sellers (bears). It shows you who won, who lost, and just how intense the fight really was.
A long green body means the bulls were clearly in charge. A long red one? A decisive win for the bears. And those little lines sticking out, the "wicks" or "shadows," are crucial—they show you where the price tried to go but was rejected, often signaling a potential shift in momentum.
Decoding Market Structure
Once you can read a single candle, the next step is to string them together to see the bigger picture: market structure. This is where true contextual analysis begins. A real trend isn't just a random walk; it has a rhythm, a clear and observable pattern.
In a solid uptrend, you'll see a series of higher highs (HH) and higher lows (HL). Each time the price pulls back, buyers step in before it can fall below the previous low. That's a clear sign of persistent demand. On the flip side, a downtrend is marked by a sequence of lower highs (LH) and lower lows (LL), showing that sellers are consistently overpowering any rally attempts.
Spotting this structure is everything. It tells you if you should be hunting for buys in an uptrend or sells in a downtrend. Fighting the dominant trend is like trying to swim up a waterfall—you might make a little progress, but it’s exhausting and rarely ends well. The skill lies in telling a real trend from choppy, sideways noise where most traders get chewed up.
"Price action's edge lies in its clarity. By focusing on market structure, you're not predicting the future; you're aligning yourself with the market's current momentum, which is a far more reliable strategy."
This isn't just theory; the numbers back it up. A historical analysis of the S&P 500 shows that once a market starts making higher highs and higher lows, it tends to keep trending up 68% of the time over the next three to six months. Backtests also often show that pure price action strategies can outperform indicator-heavy systems by 12-18% annually, mostly because they cut out the lag. You can find more great insights into why price action provides a statistical edge on learntotradethemarket.com.
Identifying Key Support and Resistance Zones
The final piece of this foundational puzzle is understanding support and resistance. A common mistake is to see these as razor-thin lines. They're not. It's much more effective to think of them as broad zones—areas on the chart where the power struggle between buyers and sellers has historically reached a tipping point.
- Support Zone: Think of this as a floor. It's an area where, in the past, buying pressure consistently showed up to stop prices from falling further.
- Resistance Zone: This is the ceiling. It’s a price region where sellers have previously stepped in and overwhelmed the buyers, halting the advance.
When the price approaches one of these zones, a price action trader sits up and pays very close attention. The behavior of the candlesticks at these levels gives you powerful clues about what might happen next. A sharp rejection wick at a known resistance zone, for example, tells a much more compelling story than a weak little candle floating in the middle of nowhere.
By weaving these three elements together—individual candlesticks, the overall market structure, and these key zones—you start to see the full narrative. You're no longer just staring at squiggles on a screen. You're reading the market’s context, understanding the flow of money, and pinpointing logical spots where high-probability trades are likely to emerge. This is the very essence of effective price action trading.
Finding High-Probability Swing Trading Setups
Once you have a handle on the market's bigger picture—its main trend and the key battlegrounds where buyers and sellers are fighting it out—you can start hunting for precise entry points. This is where specific price action patterns become your best friend. For a swing trader, these aren't some kind of magic formula; they're simply visual cues that a shift in the supply and demand balance might be happening at a location that actually matters.
Here’s the thing: context is everything. A picture-perfect pattern floating in the middle of nowhere on a chart is just noise. But if that same pattern pops up at a solid support level right after a pullback in a strong uptrend? Now that's a setup worth paying attention to.
The Pin Bar: A Story of Sharp Rejection
The Pin Bar is a classic for a reason. It’s a powerful, one-candle signal that screams "rejection," which is why price action traders love it. It looks just like a pin, with a long tail (or wick) sticking out and a small body. This pattern tells a quick, dramatic story about a failed attempt to push the price.
Let's paint a picture. A stock is climbing nicely and then pulls back to a known support area. Sellers get aggressive and try to shove the price lower, creating that long downward tail. But before the trading session ends, buyers flood in, completely rejecting those lower prices and driving the price all the way back up to close near where it opened.
That long wick is the footprint of a failed attack. It shows you that buyers are fiercely defending that level, giving you a compelling reason to consider going long. The psychology is simple but incredibly powerful: one side made a move and got completely shut down.
The Inside Bar: A Moment of Quiet Before a Big Move
The Inside Bar is a two-candle pattern that hints at consolidation and a potential explosion in volatility. It happens when one candle's entire range, from its high to its low, is completely contained within the range of the candle right before it. Think of it as the market taking a deep breath before the next sprint.
This pattern represents a temporary truce or a moment of indecision. Neither the bulls nor the bears can push the price past the previous session's boundaries. For a swing trader, this coiled spring is a fantastic breakout opportunity.
Here’s how you can play it:
- Continuation: If a stock is already in a solid trend, an inside bar often just marks a quick pause before it continues on its way. A breakout in the direction of that trend is a high-probability signal to jump in.
- Reversal: If an inside bar forms at a major support or resistance level, it might be a sign that the current trend is running out of gas. A breakout against the trend could signal a potential reversal.
The trick is to wait for the price to actually break out of the "mother bar's" range. That breakout is your confirmation of who won the quiet fight and is ready to take charge.
For swing traders looking to catch moves that last several days or weeks, patterns like the Inside Bar are gold. They give you a clear, defined risk (you can place a stop-loss just on the other side of the mother bar) and signal the potential start of a fresh leg up or down. Tools like OpenSwingTrading can help you find stocks that already have strong momentum, so when you spot an Inside Bar, you know it's happening in a name with real underlying strength.
The Engulfing Pattern: A Decisive Power Shift
The Engulfing Pattern is another two-candle setup that signals a forceful, and often immediate, change in market sentiment. A Bullish Engulfing Pattern forms when a big green candle completely swallows the body of the smaller red candle before it. On the flip side, a Bearish Engulfing Pattern is when a big red candle completely overtakes the prior green one.
This pattern is a crystal-clear picture of a power shift. In a bullish engulfing scenario, sellers were in control during the first candle. But in the next period, buyers came in with so much conviction that they not only wiped out all of the sellers' progress but also pushed the price much higher. It’s an aggressive takeover.
An engulfing pattern carries the most weight when it appears at the end of a long move and right at a key price level. A bullish engulfing at a major support zone after a downtrend is a classic reversal signal. A bearish engulfing at a resistance level after a big run-up can signal a top. This pattern doesn't just say the momentum has stalled—it tells you it has been violently reversed.
Building a Data-Driven Trading Workflow
Learning to spot classic price action setups is a fantastic skill, but in 2026, it’s really only half the battle. The real edge comes when you start layering hard, quantitative data over your qualitative chart analysis. This is where timeless chart reading meets a modern, data-driven strategy.
The whole idea is to stop chasing random patterns all over the market. Instead, you laser-focus your attention on the best setups that appear in the strongest stocks, and only when the overall market is healthy. That simple shift can dramatically improve your odds.
This gives you a repeatable, logical process. You’re no longer just trading on gut feel; you’re backing up what you see on the chart with objective data. That's a game-changer for building confidence and consistency.
Using Relative Strength to Find Market Leaders
Picture this: two stocks are showing a perfect bullish pin bar right at a key support level. On the surface, they both look like A+ trades. But what if one has been crushing the S&P 500 for months, while the other has been a total dog? Which one would you rather bet on?
That’s where relative strength (RS) comes in. And I'm not talking about the RSI indicator. This is a direct comparison of one stock's performance against a benchmark, like the S&P 500. A stock with high RS is a market leader, plain and simple. It tells you that big institutions are buying it up.
So when you spot a bullish pattern on a stock that's already showing strong relative strength, it’s a powerful confirmation. The pattern isn't just a random blip; it's a potential entry signal in a stock that the big money already loves. This alone helps you sidestep countless weak setups in laggards that are far more likely to fail.
Gauging Market Health with Breadth
The second data layer you need is market breadth. Think of it as taking the market's pulse. Breadth indicators tell you how many stocks are actually participating in a rally or a decline. Is the whole market moving up, or is it just a handful of mega-cap stocks dragging the indexes higher?
A rising tide lifts all boats, but you first need to know if the tide is actually coming in. Market breadth tells you this. Taking bullish swing trades, even in strong stocks, becomes a low-probability bet if the overall market health is deteriorating.
For example, a common metric is the percentage of stocks trading above their 50-day moving average. If that number is high and climbing, you've got a healthy, broad-based uptrend. But if it's low and falling, it's a huge warning sign that the market is weak under the surface, making it a dangerous time to open new long positions.
This process helps you zero in on high-probability swing trading setups using classic patterns.
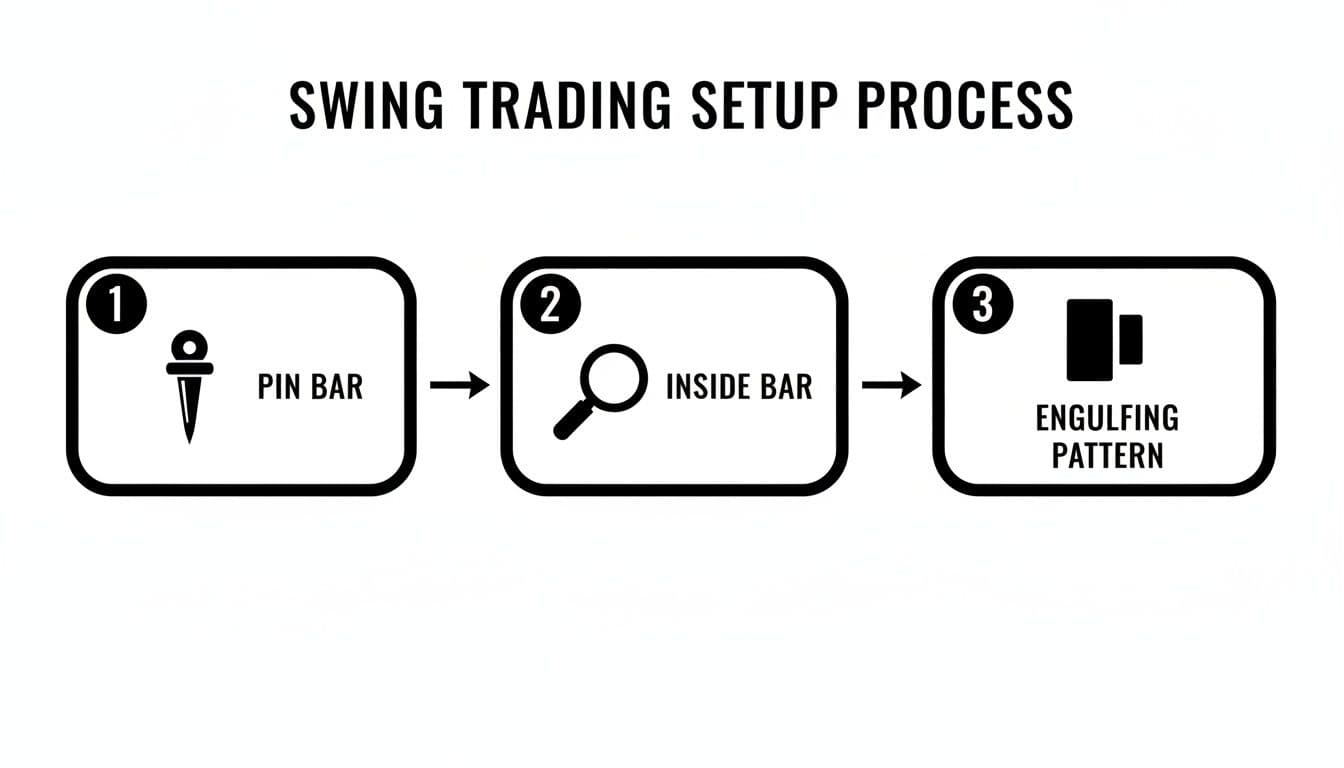
As you can see, signals like the Pin Bar, Inside Bar, and Engulfing Pattern are your trigger, but their power skyrockets when they appear in the right context—a stock and market that are already strong.
A Practical Workflow with OpenSwingTrading
Trying to piece all of this together manually is a grind. That’s where a purpose-built platform comes in handy. A tool like OpenSwingTrading lets a trader run through this entire data-driven workflow in just a few minutes.
Here’s what that looks like in 2026:
- Check Overall Market Health: First thing, you check the market's internal strength using a simple breadth dashboard. If conditions are a "red light," you know to sit on your hands and protect your capital.
- Identify Leading Sectors and Themes: Next, you follow the money. The platform shows you which sectors and industries have the strongest relative strength. This immediately narrows your universe down to the hot spots in the market.
- Find the Strongest Stocks: From there, you get a curated list of individual stocks, ranked daily by their relative strength. These are the certified leaders within the strongest groups.
Now, with this highly-filtered watchlist, you can flip over to your charts in a tool like TradingView. When you spot a classic price action setup—like an inside bar or a pin bar at support—on one of these stocks, you can take the trade with a much higher degree of confidence.
The following table breaks down how this modern approach compares to relying solely on charts.
Traditional vs Data-Enhanced Price Action Workflow
| Workflow Step | Traditional Price Action | Data-Enhanced Price Action (with OpenSwingTrading) |
|---|---|---|
| Market Analysis | Eyeballs major index charts (SPY, QQQ) for trend direction. | Checks quantitative market breadth dashboard for internal health. |
| Idea Generation | Manually scans hundreds of random charts looking for patterns. | Starts with a pre-filtered list of market-leading stocks. |
| Stock Selection | Chooses a stock based on the "prettiness" of the chart pattern alone. | Confirms the stock has high relative strength vs. the market and its peers. |
| Trade Execution | Enters a trade based on the pattern, hoping the market cooperates. | Enters a trade knowing the stock, sector, and market winds are at their back. |
| Confidence Level | Based on subjective chart interpretation and "gut feel." | Based on objective data confirming a qualitative setup. |
Ultimately, this process gives you an edge. You’ve confirmed the stock is strong, its sector is strong, and the overall market isn’t about to pull the rug out from under you. Fusing classic price action trading with modern data analysis is what truly separates the consistently profitable traders from everyone else.
Managing Risk and Avoiding Common Traps
Spotting a great setup is one thing, but knowing how to manage it is what actually makes you money. It's a hard truth, but even the most perfect-looking entry can fail spectacularly. The real secret separating the pros from the rest of the pack is how they handle the trades that go wrong.
In price action trading, risk management isn't just some boring topic you cover once and forget. It's woven directly into how you read the chart. The goal is simple but absolutely non-negotiable: protect your capital at all costs. You have to ensure that one bad trade—or even a string of them—doesn't wipe you out. For a swing trader, this means your plan is locked in before you even think about hitting the "buy" button.
Setting Stops Based on Market Structure
Let's get one thing straight: setting a random stop-loss like "I'll sell if it drops 5%" is a rookie move. Price action gives you a much smarter way to define your risk. Your stop-loss should be placed at the exact point on the chart where your original trade idea is proven completely, undeniably wrong.
How do you find that point? You let the market structure be your guide.
- Going long? Your stop should sit just below a major support level, the low of a bullish candle pattern (like a pin bar), or the last swing low in the uptrend. If the price breaks through that floor, the reason you entered the trade is officially gone.
- Going short? Place your stop just above a clear resistance ceiling, the high of a key bearish pattern, or the last swing high in the downtrend.
When you tie your stop-loss to the chart's story, you give the trade room to move naturally without exposing your account to catastrophic losses. It's a far more logical approach than using a fixed percentage that ignores what the stock is actually doing.
Sizing Positions for Long-Term Survival
Once you know exactly where your stop-loss will go, you can figure out your position size. This might just be the single most important skill in trading. The idea is to risk only a tiny, fixed percentage of your total capital on any single trade, typically between 1% and 2%.
Think about it this way: if you have a 25,000** account and you stick to a **1%** risk rule, the absolute most you can lose on any given trade is **250. If your stop-loss is 2** per share below your entry price, the math is simple. You can buy **125** shares (**250 / $2). This discipline ensures that a nasty losing streak is just a small setback, not a career-ending event. It’s what keeps you in the game.
Risk management is the bedrock of a successful trading career. It shifts your focus from hoping a trade works out to building a system where individual outcomes don't matter as much as consistent, disciplined execution over the long haul.
Avoiding Common Psychological Traps
The final piece of the risk management puzzle is you. The chart is just a reflection of human emotion, and it’s a minefield for cognitive biases that can destroy even the best trading plan. Price action traders have to be hyper-aware of these mental traps.
Here are the two biggest culprits:
- Confirmation Bias: This is our natural tendency to seek out and overvalue information that confirms what we already believe. If you’re bullish on a stock, you might fixate on one tiny bullish candle while conveniently ignoring the massive bearish pattern from three days ago. A system like OpenSwingTrading helps you fight this by layering in objective data like relative strength, forcing you to ground your analysis in facts, not your gut feelings.
- Perfection Paralysis: Some traders get stuck waiting for the "perfect" setup—one where every single star aligns. The problem is, these textbook setups rarely happen in the wild. The goal isn’t to find flawless trades; it’s to find high-probability ones where the potential reward heavily outweighs the risk. Effective price action trading in 2026 is about making smart decisions with the information you have, not waiting for a level of certainty that will never come.
Answering Your Questions About Price Action Trading
As you start putting these ideas into practice, you're bound to have questions. That's a good thing. Learning to read price action is a skill you build over time, and getting clear on the common sticking points is a huge part of the journey. Here are some of the most frequent questions traders have in 2026, along with my straight-to-the-point answers.
Is Price Action Trading a Good Place for Beginners to Start?
It can be, but you have to be disciplined. In fact, I think it’s one of the best ways for a new trader to learn, because it forces you to understand how markets actually behave instead of just blindly following a lagging indicator.
The secret is to keep it simple. Don't try to learn twenty different candlestick patterns at once. Instead, get really good at spotting just one or two powerful setups, like a pin bar or an inside bar, right at a major support or resistance level. If you build that solid foundation in market structure first, you'll sidestep the frustrating guesswork that trips up so many traders.
Do Pure Price Action Traders Use Any Indicators?
Plenty do, yes. But here's the crucial difference: they use them for confirmation, not for the entry signal itself. The price chart and its structure always lead the way. The goal is to avoid that classic "analysis paralysis" where you have five different indicators all screaming different things.
For example, a swing trader might keep a 20-period moving average on their chart just to get a quick visual on the trend. If the price is trading above it and they spot a bullish pin bar bouncing off a support level, the moving average just adds a little extra confidence. It supports the story the price is already telling; it doesn't write the story.
The best swing traders I know use price as the signal and everything else as context. This is where a tool like OpenSwingTrading comes in, giving you that objective context—like market breadth and relative strength—without cluttering your charts with lagging indicators.
How Long Does It Take to Get Good at This?
There’s no magic number here. It all comes down to your dedication and the hours you put in front of the charts. Most traders I’ve talked to say it takes at least six months to a year of consistent, focused practice before they feel truly comfortable reading price flow and sticking to their plan.
Getting good isn’t about memorizing patterns. It's about developing a real feel for the market's rhythm and understanding the context behind every move. The fastest way to speed up that process is to build a daily routine: review your charts, journal every single trade (the good, the bad, and the ugly), and focus on executing your process perfectly, not on how much money you made on any one trade.
What's the Single Biggest Mistake Most Price Action Traders Make?
Hands down, it's ignoring market context. A trader sees a textbook-perfect engulfing candle and immediately dives in, but they forget to ask the most important questions. Where did this pattern show up? Is it actually moving with the dominant trend? Is it forming at a price level that even matters?
A candlestick pattern without context is just random noise. A swing trader's edge comes from finding a great pattern at a great location—a spot where the odds are already stacked in their favor. This is exactly why a data-driven workflow that confirms the stock's underlying strength and the overall market's health is so essential for success in 2026.
Ready to stop chasing random patterns and start focusing on high-probability setups? OpenSwingTrading provides the data-driven context you need to find market-leading stocks and trade with the wind at your back. Start your free 7-day trial today and see the difference a systematic workflow can make.