Master the Relative Strength Index Calculation for Swing Trading
A practical guide to the Relative Strength Index calculation. Learn the RSI formula, smoothing methods, and how to apply it for smarter swing trading.
The Relative Strength Index is all about one thing: comparing how strong the up-moves have been versus the down-moves over a set time, usually 14 days. That comparison spits out a single number between 0 and 100, giving you a clean read on a trend's internal momentum. If you're going to trade with RSI, getting a feel for the math behind it is non-negotiable.
Decoding the Relative Strength Index Calculation
To really trust what the RSI is telling you, you have to get what's going on under the hood. It’s not just some squiggly line; it's a finely-tuned engine built to measure momentum. For a swing trader, understanding this engine is the difference between blindly following signals and truly analyzing what the market is doing. This understanding is key for identifying high-probability setups and managing trades effectively over days or weeks.
The whole process starts with the basics: price changes. For each day in your lookback period, you figure out if the price went up or down. That's it. This raw data is the foundation for everything else.
To make sense of the RSI formula, it helps to break it down into its core parts. Each component plays a specific role in turning raw price changes into a meaningful momentum oscillator.
The table below summarizes these key variables and what they do.
Core Components of the RSI Formula
| Component | Purpose | Calculation Method |
|---|---|---|
| Gains & Losses | The raw input data. Captures the upward or downward price movement for each period. | Calculated daily based on the closing price difference from the previous day. |
| Initial Average | Establishes the baseline for the first RSI value. A simple average of the first 14 periods. | (Sum of Gains over 14 periods) / 14 and (Sum of Losses over 14 periods) / 14. |
| Smoothed Average | The ongoing average that gives more weight to recent data. The heart of the RSI's responsiveness. | [(Previous Avg. Gain) * 13 + Current Gain] / 14 (Same logic applies to losses). |
| Relative Strength (RS) | The core ratio that compares the strength of up-moves to down-moves. | Smoothed Average Gain / Smoothed Average Loss. |
| RSI Value | The final, normalized oscillator value. Converts the RS ratio into an easy-to-read 0-100 scale. | 100 - [100 / (1 + RS)]. |
This breakdown shows how each step logically builds on the last, from simple daily price changes to the final normalized indicator value you see on your chart.
The Two-Stage Averaging Process
The real secret to the relative strength index calculation is its unique, two-part averaging method. It doesn't just treat all price changes the same. Instead, it uses a special smoothing technique that makes recent data matter more, keeping the indicator responsive without getting thrown off by every little market hiccup.
Here’s a simple breakdown of how it works:
- The Baseline: For the very first calculation, it’s just a simple 14-period average. Add up all the gains from the first 14 periods and divide by 14. Do the exact same for the losses. This sets the starting point.
- Wilder’s Smoothing Method: After that first calculation, the formula changes. From the 15th period onward, a new, smoother average takes over. It mixes the new gain or loss with the previous average, creating a running tally that has a "memory."
This smoothing technique is what helps swing traders stay on the right side of the primary momentum. It filters out the noise, stopping the RSI from jumping around on minor price swings so you can focus on the moves that actually matter, making it easier to hold winning trades through minor pullbacks.
As a swing trader, knowing the RSI smooths its data is a huge confidence booster, especially during pullbacks. You understand it's built to see past the day-to-day noise and focus on the underlying trend strength—which is exactly what you need when holding a trade for days or weeks.
The RSI was introduced back in 1978 by J. Welles Wilder Jr., an engineer-turned-analyst, in his classic book, New Concepts in Technical Trading Systems. His formula hinges on comparing the average gain to the average loss. While the initial calculation is a simple average, all subsequent ones use a smoothing formula: Average Gain = [(previous Average Gain) × 13 + current Gain] / 14. This method, which you can learn more about on TrendSpider.com, ensures that the most recent price action always has the greatest impact.
Calculating RSI Manually With a Real-World Example
Reading about a formula is one thing, but actually crunching the numbers yourself is how you build real confidence in an indicator. Let's roll up our sleeves and walk through a 15-day example to see how the RSI engine works from the ground up. This is a must-do exercise for any trader who wants to truly understand their tools.
The entire process kicks off by calculating the price change from one day to the next. Then, you simply split those changes into two columns: one for gains and one for losses. This separation is the heart of the RSI, letting us compare the strength of the bulls versus the bears.
Setting Up the Data
Let's use a sample stock with 15 days of closing prices. We want to calculate a 14-period RSI, so we need that extra 15th day of data to get our first "smoothed" value.
| Day | Close Price | Change | Gain | Loss |
|---|---|---|---|---|
| 1 | $44.33 | - | - | - |
| 2 | $44.09 | -$0.24 | 0 | 0.24 |
| 3 | $44.15 | +$0.06 | 0.06 | 0 |
| 4 | $43.61 | -$0.54 | 0 | 0.54 |
| 5 | $44.33 | +$0.72 | 0.72 | 0 |
| 6 | $44.83 | +$0.50 | 0.50 | 0 |
| 7 | $45.10 | +$0.27 | 0.27 | 0 |
| 8 | $45.18 | +$0.08 | 0.08 | 0 |
| 9 | $45.85 | +$0.67 | 0.67 | 0 |
| 10 | $46.08 | +$0.23 | 0.23 | 0 |
| 11 | $45.89 | -$0.19 | 0 | 0.19 |
| 12 | $46.03 | +$0.14 | 0.14 | 0 |
| 13 | $45.61 | -$0.42 | 0 | 0.42 |
| 14 | $46.28 | +$0.67 | 0.67 | 0 |
| 15 | $46.22 | -$0.06 | 0 | 0.06 |
Notice how we only populate the "Gain" column when the price goes up, and the "Loss" column (with a positive number) when the price goes down. This simple setup is the foundation for everything that follows.
Calculating the Initial Averages
To get our very first RSI value on Day 14, we start with a simple average of the gains and losses over the initial 14 periods (from Day 2 to Day 14).
- Sum of all Gains (Days 2-14): 0.06 + 0.72 + 0.50 + 0.27 + 0.08 + 0.67 + 0.23 + 0.14 + 0.67 = **3.34**
- Sum of all Losses (Days 2-14): 0.24 + 0.54 + 0.19 + 0.42 = $1.39
Now, we just divide by 14 to get the average:
- Initial Average Gain: 3.34 / 14 = **0.2386**
- Initial Average Loss: 1.39 / 14 = **0.0993**
This establishes our baseline. The flowchart below gives a great visual of how we go from these raw gains and losses to the final RSI reading.
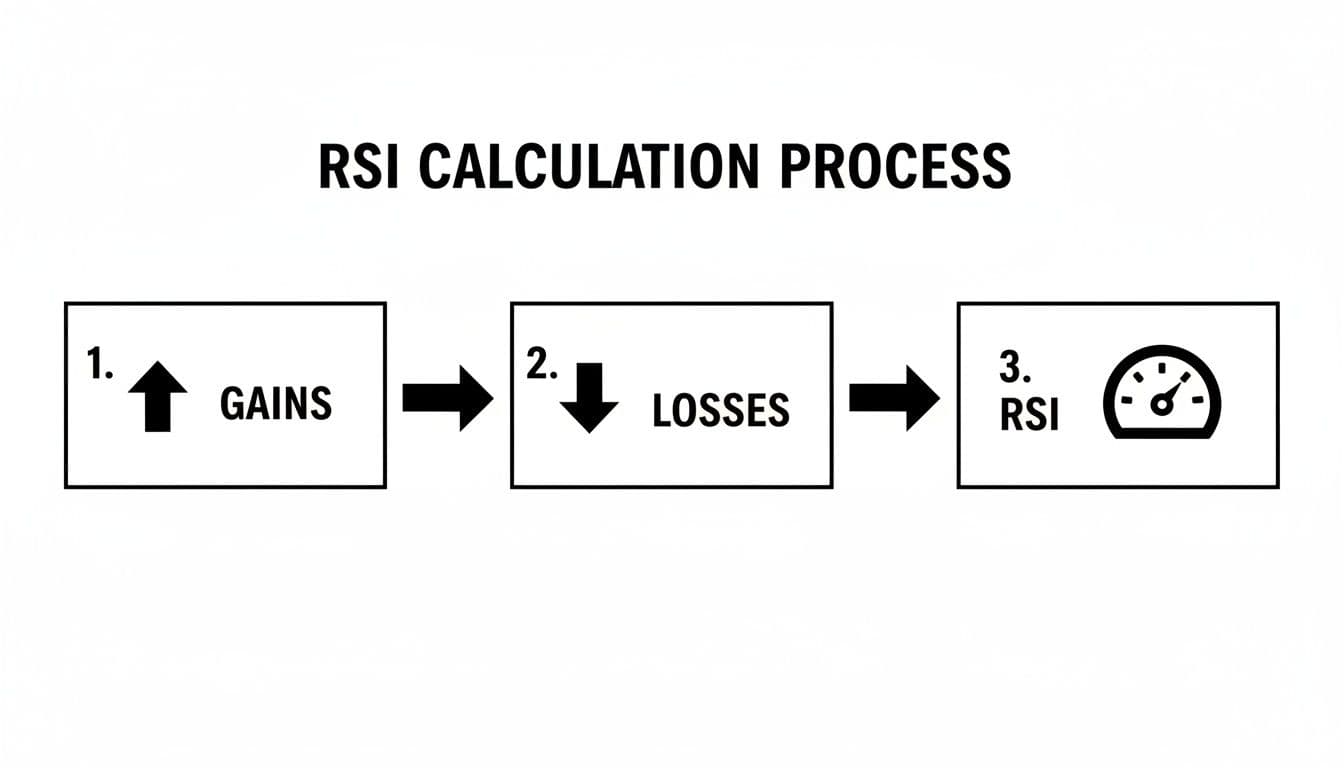
As you can see, the whole idea is to compare the magnitude of the up-moves to the down-moves and then normalize that relationship into an easy-to-read oscillator.
Smoothing and the Final Calculation
Here's where it gets interesting. Starting on Day 15, we stop using a simple average and switch to Wilder's smoothing method. This is a type of exponential moving average that gives more weight to recent data without completely forgetting older price action. It makes the indicator less choppy.
Let's calculate the smoothed averages for Day 15:
- Smoothed Average Gain: [ (Previous Avg. Gain × 13) + Current Gain ] / 14
- [ (0.2386 × 13) + 0 ] / 14 = **0.2216** (The gain on Day 15 was 0)
- Smoothed Average Loss: [ (Previous Avg. Loss × 13) + Current Loss ] / 14
- [ (0.0993 × 13) + 0.06 ] / 14 = **0.0965** (The loss on Day 15 was 0.06)
With these fresh, smoothed averages, we can calculate the Relative Strength (RS).
Relative Strength (RS) = Smoothed Average Gain / Smoothed Average Loss
RS = 0.2216 / 0.0965 = 2.2964
Finally, we plug that RS value into the main formula to get our RSI number.
RSI = 100 - [ 100 / (1 + RS) ]
RSI = 100 - [ 100 / (1 + 2.2964) ] RSI = 100 - [ 100 / 3.2964 ] RSI = 100 - 30.33 RSI = 69.67
Walking through this step-by-step shows you that the RSI isn't some black box. It’s a logical measurement of sustained buying or selling pressure. For a swing trader, that deep understanding is critical—it’s a core principle of the entire OpenSwingTrading approach.
How to Calculate RSI With Your Own Tools
Knowing the formula is one thing, but actually putting it to work is what matters. Taking the relative strength index calculation from a theoretical concept to a practical tool is how you start building a system that fits your specific trading style. This is where you move past just looking at a chart and begin creating a workflow that's truly data-driven.
Let's translate our manual calculations into the platforms you probably use every day. This isn't just about recreating an indicator you can find anywhere; it's about understanding the engine under the hood. Once you get it, you can build custom scanners, backtest new ideas, and sanity-check the signals your charting software is giving you.
This hands-on approach is a core part of the OpenSwingTrading philosophy. Gaining a deep understanding of your tools is what gives you a real analytical edge—it’s the key to sticking with strong trends and buying pullbacks with conviction.
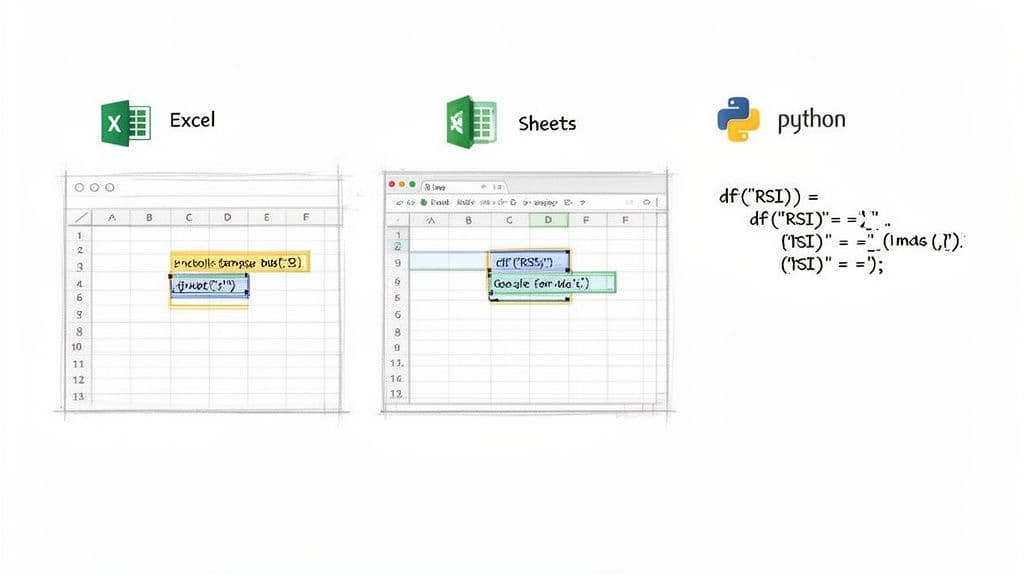
Building RSI in a Spreadsheet
Whether you're a Microsoft Excel veteran or a Google Sheets fan, the logic is identical. Spreadsheets are fantastic for this because they let you see the entire calculation unfold, just like we did by hand. You can literally watch how each day's price change feeds into the smoothed averages and nudges the final RSI value up or down.
Here’s a quick-and-dirty setup for a 14-period RSI:
- Column A: Date
- Column B: Closing Price
- Column C (Change):
=B3-B2 - Column D (Gain):
=IF(C3>0, C3, 0) - Column E (Loss):
=IF(C3<0, ABS(C3), 0) - Column F (Avg Gain): In cell
F16, get the initial average:=AVERAGE(D3:D16). Then, inF17and below, apply Wilder's smoothing:=((F16*13)+D17)/14. - Column G (Avg Loss): Do the same for losses. In
G16:=AVERAGE(E3:E16). InG17:=((G16*13)+E17)/14. - Column H (RS):
=F16/G16 - Column I (RSI):
=100-(100/(1+H16))
Just drag these formulas down, and you have a running RSI calculator. Building it yourself really cements the concepts and gives you a powerful way to slice and dice historical data for any stock you're watching.
Automating the RSI Calculation with Python
For traders who need to chew through huge datasets or build automated systems, Python is the perfect tool. Using a couple of popular libraries—pandas for handling the data and talib for the technical analysis—the whole process becomes incredibly simple. This is exactly what you’d do if you wanted to backtest how RSI performed on your entire watchlist over the last year.
This little script shows just how easy it is to add RSI to a list of historical prices:
import pandas as pd import yfinance as yf import talib as ta
Fetch historical stock data for 2026
data = yf.download('AAPL', start='2026-01-01', end='2026-12-31')
Calculate the 14-period RSI
data['RSI_14'] = ta.RSI(data['Close'], timeperiod=14)
Display the last few rows with RSI values
print(data.tail())
Pro Tip From Experience: When you're automating with Python, always pull more historical data than you think you need. Libraries like
talibneed a "warm-up" period to calculate those first smoothed averages correctly, just like your charting platform. Not having enough lead-in data is the #1 reason I see for discrepancies between a script's output and a trading chart.
A few lines of code replace dozens of manual steps, freeing you up to focus on strategy development instead of tedious number-crunching. It's a perfect example of how to build a smarter, more efficient trading workflow.
Reading RSI Beyond Overbought and Oversold Levels
Most traders learn the classic 70/30 overbought/oversold rule and call it a day. But for a swing trader, that’s just scratching the surface. The real edge comes from understanding how the Relative Strength Index acts in different market environments, particularly when a strong trend is in play.
If you automatically sell every time RSI hits 70 in a roaring bull market, you're going to leave a ton of money on the table. In a powerful uptrend, an RSI reading above 70 isn't a reversal signal; it's often a confirmation of powerful momentum. It’s the market telling you that buyers are in complete control and the trend is healthy. This shift in perspective is what separates traders who ride trends from those who get run over by them.
Understanding RSI Range Shifts
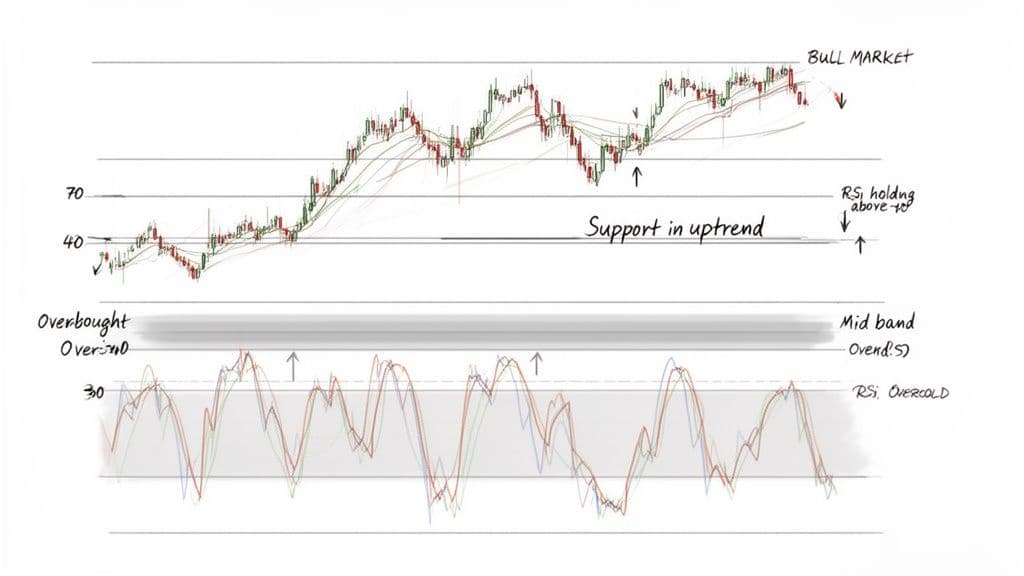
The market is dynamic, and so is the RSI. The indicator’s behavior adapts to the prevailing trend, a concept known as range shifting. This simply means the effective "overbought" and "oversold" zones move depending on whether you're in a bull or bear market.
Pioneering technical analysts figured out that the 70/30 levels are not set in stone. In a solid uptrend, you’ll often see the RSI find support somewhere in the 40 to 50 zone, rarely even sniffing the 30 level. On the flip side, during a downtrend, RSI might hit a wall at the 50 to 60 resistance zone and fail to push higher.
This isn't just an interesting theory; it's a practical way to find better entries. Analyst Andrew Cardwell was one of the first to document this, noting that uptrends typically see RSI oscillate between 40 and 80, while downtrends are often contained between 20 and 60. You can dig deeper into these RSI interpretations on Wikipedia to see how this insight transforms the indicator from a simple reversal tool into a much smarter trend-following guide.
For an open swing trader, recognizing these range shifts is a game-changer. It helps you buy pullbacks with confidence. When a stock in a strong uptrend pulls back and its RSI finds support near 40, it's not a sign of weakness—it's often a prime opportunity to add to your position before the next leg up.
RSI Behavior in Bull vs Bear Markets
To put this into practice, it helps to see how these ranges function side-by-side. The key is to adapt your expectations based on the market's primary direction.
| Market Condition | Typical RSI Range | Key Support Zone | Key Resistance Zone | Trading Implication |
|---|---|---|---|---|
| Bull Market | 40-80+ | 40-50 | 70+ (Momentum) | Buy pullbacks into the 40-50 support zone. Over 70 confirms strong trend. |
| Bear Market | 20-60 | 30- (Exhaustion) | 50-60 | Short rallies into the 50-60 resistance zone. Under 30 shows weakness. |
This table simplifies the concept of range shifts. By identifying the current trend first, you can use the RSI with far more precision, aligning your trades with the dominant market force.
Practical Application for Swing Traders
Let's make this actionable. When you're looking at a chart for a potential swing trade, don't just glance at today's RSI value. Scroll back a few months and see how it has behaved. Look for its typical operating range.
Here’s how you can use this in your trading:
- In a Bull Market: If you notice the RSI is consistently bouncing off the 40-50 level during pullbacks, that zone becomes your new, more reliable "oversold" signal. A dip to that level presents a potential entry that’s in sync with the primary uptrend. This provides a clear, repeatable setup for capitalizing on market strength.
- In a Bear Market: Likewise, if a stock is trending down and the RSI repeatedly fails to push past 60 on bounces, that level acts as your new "overbought" signal. It’s a great spot to look for short entries or take profits on any counter-trend longs.
By moving beyond the fixed 70/30 levels, your relative strength index calculation becomes a more dynamic and intelligent tool. It helps you listen to the market's true character, filter out the noise, and focus on what the underlying momentum is really telling you.
Integrating RSI Into a Smarter Trading Workflow
Knowing the relative strength index calculation is one thing, but making it work for you is another. On its own, RSI is just a number. Its real power comes alive when you weave it into a broader, more structured trading workflow.
If you just chase every overbought or oversold signal without any context, you're going to have a bad time. It’s a classic mistake and a recipe for frustration.
Instead, I think of RSI as a confirmation tool. It's that final check before I put capital on the line. For my swing trading, this means I use RSI to sharpen the timing on opportunities that have already passed my initial market analysis. It's not the reason for the trade; it's the component that helps me time the entry.
This mindset shifts you away from chasing random signals and toward executing well-vetted, high-probability setups. When you blend the precision of the RSI calculation with the bigger picture, you can trade with far more conviction.
Enhancing Your Daily Market Review
A smarter workflow doesn't start with a stock chart. It starts with the market itself. The goal is to first find where the money is flowing and then use RSI to pick the best entry points on the stocks benefitting from that flow. This top-down, data-first process is the core philosophy of what we do at OpenSwingTrading.
Here’s a practical workflow you could use in 2026:
- First, Check the Market's Pulse: Start your day with broad market breadth indicators. Are more stocks going up than down? Is participation healthy? This tells you if the environment is even right for taking long trades.
- Then, Find the Strongest Sectors: Use relative strength analysis to pinpoint which sectors are outperforming. Trading the best stocks in the strongest sectors is like having a tailwind.
- Finally, Scan for Individual Leaders: Run a scan to find the top-ranked stocks based on volatility-adjusted relative strength. This gives you a high-potential, focused watchlist to work from.
It’s only at this point—after you've done the strategic homework—that RSI comes into play. With your curated list of market leaders, you can now apply your understanding of the RSI calculation to find your spot.
The sweet spot for swing trading is using RSI to time entries on minor pullbacks within a major uptrend. When a leading stock dips and its RSI cools off to a known support level, like 40 or 50, that often flags a prime, low-risk entry just before the next leg up begins. This disciplined approach maximizes your chances of catching significant multi-day moves.
This approach ensures you're only applying RSI to stocks with proven momentum and institutional backing. You stop trying to catch falling knives or guess bottoms in weak names. Instead, you're just using a great oscillator to time your entry into an already powerful trend.
Answering Common Questions About the RSI Calculation
Even after you've got the math down, a few practical questions always pop up when you start using the Relative Strength Index calculation on live charts. It's totally normal. Getting these sorted out will help you use the indicator with more confidence, especially when the market is moving fast like it has been in 2026.
Let's tackle the things I get asked most often.
Why Does My Manual Calculation Differ From My Charting Platform?
This is, without a doubt, the number one question. The answer almost always boils down to the initial "warm-up" period for the first average.
Platforms like TradingView have access to a huge backlog of historical data, often using hundreds of price bars to get that first smoothed average gain and loss. This gives their calculation an incredibly stable foundation from the get-go.
When you're doing it by hand or in a spreadsheet, you usually start with a simple 14-period average. That creates a slightly different starting point. And because Wilder's smoothing formula links every new value to the one before it, that tiny initial difference can linger for a long time.
For a swing trader, this is just noise. The slight difference in decimal points is completely insignificant. The overall shape of the RSI and its key levels will be virtually identical, and that’s what we actually use to find our edge.
The big takeaway here is not to get lost in the weeds trying to match your platform to the third decimal place. Focus on what the indicator is telling you about momentum and key levels—that's where the real money is made.
What Is the Best Lookback Period for RSI?
The 14-period setting that J. Welles Wilder originally suggested is still the gold standard, and for good reason. It hits a sweet spot between being responsive enough for swing trading without being overly sensitive. Playing around with it can drastically change how the indicator behaves.
- Shorter Periods (like 7 or 9): This makes the RSI hyper-sensitive. It'll react to every little price tick, which means more signals. The problem is, most of those signals are just market noise, and you'll get whipsawed constantly.
- Longer Periods (like 21 or 25): This smooths everything out, making the RSI much slower. It's better for confirming a long-term trend, but it's way too slow for timing swing trades. By the time it signals, the best part of the move is often over.
For the vast majority of swing traders, sticking with the default 14-period setting is the way to go. It has stood the test of time for decades and works perfectly for typical swing trade durations.
Can I Use the RSI Calculation for Crypto or Forex?
Of course. The beauty of the RSI is that its math is entirely based on price change. It doesn't care what the underlying asset is, which makes it a truly universal tool.
You can apply it just as effectively to any market that has decent liquidity and price history. This includes:
- Cryptocurrencies
- Forex pairs
- ETFs
- Commodities
The core concepts—reading momentum, spotting divergences, and seeing when a market is overextended—are the same no matter what you're trading. It’s one of those foundational indicators that belongs in every trader's arsenal.
At OpenSwingTrading, we're firm believers that truly understanding your tools is the first step toward building a smarter, data-driven workflow. When you combine a deep knowledge of indicators like RSI with solid market analysis, you can stop chasing random patterns and start executing trades with a real statistical edge. Find yours and start a free trial at openswingtrading.com.