Relative strength stock screener: how it works daily
Relative strength stock screener: how it works daily
An explainer of how a relative strength stock screener runs day to day—define outperformance vs a benchmark, compute returns correctly, convert them into RS scores (percentiles/alpha/blends), and refresh rankings with clean data plus practical liquidity and trend filters.

If your relative strength screener “worked yesterday” but the top names flip overnight, the issue usually isn’t the market—it’s the mechanics. Small choices like benchmark, lookback window, and how you treat splits or dividends can change who ranks #1.
This explainer walks through what an RS screener needs each day, how returns and scores are computed, and what happens during the daily refresh. You’ll also see the filters that keep rankings tradable and the common failure modes that make results disagree across tools.
Table of Contents
- Daily RS goalOutperformance conceptBenchmark choiceLookback window
- Data it needsPrice seriesUniverse definitionsCalendar alignmentSurvivorship control
- Return computationSimple vs logDividends splitsVolatility smoothing
- Relative strength scoreRatio vs differencePercentile rankingRegression alphaMulti-window blend
- Daily refresh mechanicsRolling window shiftBenchmark move impactRebalance timing
- Filters and gatesLiquidity constraintsPrice and capTrend confirmationCorporate events
- Why results differ
- Common failure modes
- Lock in a repeatable daily RS routine
- Frequently Asked Questions
- Turn Daily RS Into Watchlists
Daily RS goal
Relative strength in a screener is a simple daily question: “Did this stock beat my benchmark over the last N days?” You’re not hunting for green candles. You’re hunting for higher relative return versus a reference like SPY, over a fixed lookback window.
Outperformance concept
“Strong” means the stock’s return is higher than the benchmark’s return over the same period. A stock can be up 5% and still be weak if SPY is up 8%. The core quantity is relative return: stock return minus benchmark return, like “+3% vs SPY.”
Benchmark choice
Your benchmark defines what “strong” even counts as, because it sets the bar.
- SPY for broad market strength
- Sector ETF for within-sector leaders
- Custom universe index for your tradable set
Pick the wrong benchmark and you’ll crown the wrong winners.
Lookback window
Lookbacks like 20, 63, and 126 trading days map to about one month, one quarter, and half a year. Short windows react fast but whip around on noise. Longer windows smooth results but lag turns, like a 126-day leader that’s already rolling over.
Data it needs
A daily relative strength screener is only as stable as its inputs. Feed it inconsistent prices, shifting universes, or mismatched calendars, and your “top performers” become noise.
You want the same math to run every day, on comparable data, with the same eligibility rules. That’s the baseline for trustworthy ranks.
Price series
You need one price series per symbol that produces comparable returns across dates. A 10% move should mean “market moved,” not “split happened.”
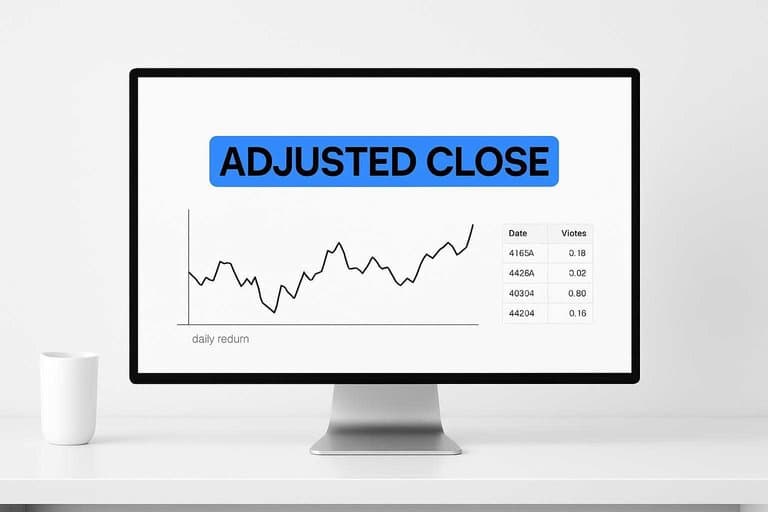
Use adjusted close for return calculations when corporate actions exist. Use close when you need the traded print, like for gap logic.
- Splits: normalize share count changes
- Cash dividends: prevent fake “drops” on ex-date
- Spinoffs/rights: keep returns continuous
- Symbol changes: preserve history mapping
If your chart has cliffs on dividend dates, your ranks will too.
Learn more about what “Adjusted Close” means.
Universe definitions
Your screener needs hard membership rules so the pool doesn’t change randomly. Otherwise you’re ranking a different game every day.
- Restrict exchanges (NYSE, Nasdaq)
- Set market-cap floor
- Enforce liquidity threshold
- Exclude halted/OTC names
- Optional sector/industry filters
Fixed rules beat “whatever data showed up today.”
Calendar alignment
Your screener needs a shared trading calendar so stock and benchmark returns use the same dates. One missing bar can invent outperformance.
Handle three cases explicitly:
- Holidays: no returns computed for that date
- Missing bars: mark as missing, don’t forward-fill returns
- Different sessions: align to the primary close timestamp
If the benchmark uses Monday-to-Monday, your stocks must too.
Survivorship control
You need delisted names and point-in-time membership to avoid “only winners” math. A universe that forgets failures will always look strong.
Use point-in-time constituents for your universe and benchmarks. Include symbols that were tradable then, even if they later vanished.
If your backtest never sees bankruptcies, your screener is grading on a curve.
Return computation
Your screener starts by turning raw daily prices into returns you can compare across tickers and against a benchmark. Do it consistently, and your rankings reflect performance, not quirks in price scale or corporate actions.
Simple vs log
Simple returns are intuitive because they match what your account feels like: “up 1.2% today.” Log returns add cleanly over time, which makes multi-day math tidy.
Most screeners still rank on simple returns because percent change is easier to explain and rarely changes ordering on daily horizons. Use log returns when you model or regress, not when you need a readable leaderboard.
Dividends splits
Corporate actions can fake performance if you use raw closes, so you need adjustments before you compute returns.
- Pull adjusted close for each stock and benchmark.
- Compute daily return from adjusted prices.
- Chain daily returns into a cumulative return series.
- Spot-check split dates for flat, not spiky, returns.
- Confirm the benchmark uses the same adjustment rules.
If stock and benchmark adjustments differ, your “relative strength” is partly accounting noise.
Volatility smoothing
Daily returns are noisy, so some screeners smooth them to reduce whipsaws and ranking churn. Common tricks include moving-average returns, rolling regressions versus the benchmark, or averaging relative strength over a window.
Smoothing makes signals more stable, but it also reacts later when leadership changes. If you smooth, you’re choosing fewer false positives in exchange for slower exits and entries.
Relative strength score
Your “RS score” is never just one number. It’s a stack of choices: return math, ranking method, lookback windows, and smoothing. Different vendors disagree because they pick different defaults, then brand the result as “RS.”
Ratio vs difference
Two stocks can beat a benchmark by the same amount and still get different “strength” depending on the math. Vendors often choose a ratio because it magnifies outsized winners, even when the benchmark also moved.
A return difference is simple: RS_raw = stock_return − benchmark_return. A return ratio is multiplicative: RS_raw = (1 + stock_return) / (1 + benchmark_return) − 1.
Ratio-based RS rewards big upside bursts more than steady outperformance, so your top decile can change fast.
Percentile ranking
Most “0–100 RS scores” are ranks, not returns. The raw RS becomes a relative position inside a chosen universe.
- Compute RS_raw per stock for the lookback window.
- Sort all stocks by RS_raw, best to worst.
- Convert rank to percentile, then map to 0–100.
- Break ties with a fixed rule, like market cap.
Change the universe or tie-breaker and the same stock gets a new “score.”
Regression alpha
Some vendors treat relative strength as a regression problem, not a return comparison. They run stock daily returns against benchmark daily returns and use the intercept.
In that setup, “alpha” is the average daily excess return after accounting for benchmark moves. If alpha is +0.03% daily, that’s about +7.8% annualized before compounding assumptions.
Alpha-based RS can stay high even when beta is low, which surprises ratio-only screeners.
Multi-window blend
Single-window RS is twitchy, so many vendors blend windows to reduce whipsaws. You’ll usually see some version of these mixes.
- 3/6/12-month weighted blend
- 1/3/6/12-month with recent emphasis
- Exclude last week to avoid gaps
- Add smoothing, like a moving average
Blends are a trade: you gain stability, but you may enter breakouts later.
Daily refresh mechanics
Your screener refreshes daily because relative strength (RS) is a moving comparison, not a fixed badge. Even if your stock prints the same close, its score can drift when the lookback window shifts or the benchmark moves.
That’s why “flat price” can still mean “different rank” by tomorrow.
Rolling window shift
RS usually uses a rolling lookback, like 63 or 252 trading days, because you want recent leadership, not ancient history. Each new close adds one day and drops one day, and that swap can change the cumulative return.
Think in simple terms:
- Yesterday’s return = (Today / StartDay) − 1
- Tomorrow’s return = (Tomorrow / NextStartDay) − 1
If the dropped day was a big up day, your base rises and the same price level looks weaker. If the dropped day was a big down day, your base falls and your return “improves” without doing anything new.
That base effect is why scores drift in quiet tapes.
Benchmark move impact
RS is a race against something else, so the benchmark’s day matters as much as your stock’s day. When the benchmark changes, your relative return changes, even if you don’t.
- Broad rally: benchmark up, flat stock ranks slip
- Broad selloff: benchmark down, flat stock can rise
- Sector rotation: index flat, leaders reshuffle underneath
- Gap days: overnight moves compress or explode spreads
- Rebalance flows: benchmark constituents pull attention and capital
Relative metrics are zero-sum-ish: for you to climb, someone else usually falls.
Rebalance timing
Your refresh time is a data choice disguised as a strategy choice. Close-to-close RS updates after the official close prints, while open-to-close schedules can update earlier but change what “one day” means.
If you rank on close data, today’s rank isn’t final until you have today’s close for both stock and benchmark. If you rank on open data or intraday snapshots, you can update sooner, but you’ll include names that may not qualify by the close.
Data availability sets the clock, and the clock decides who makes the cut.
Filters and gates
Relative strength (RS) is the ranking engine, but filters are the guardrails. They keep your “top 20” from being untradeable, unpriced, or distorted by one-off events.
For a practical example of how RS lists can differ by horizon and benchmark, see this guide on screening by relative strength.
Liquidity constraints
RS can look perfect on a chart and still trade like a trap. Liquidity gates exist to cut slippage, reduce stale prints, and stop gap-driven “strength” from sneaking in.
Thin names can fake RS when they jump 12% on one trade, then don’t trade for hours. A simple dollar-volume floor (like “>$5M/day”) forces the screener to live where spreads are tighter and prices update continuously.
If RS is your signal, liquidity is your execution tax—minimize it early or you’ll pay it later.
Price and cap
These gates stabilize the universe so RS compares like with like. You’re removing microstructure weirdness, not “missing opportunities.”
- Require price > $5
- Set minimum market cap
- Exclude ADRs and OTC
- Remove levered ETNs
Your RS list is only as clean as the universe you rank.
Trend confirmation
RS can surface fast movers that are still in downtrends. Trend confirmation keeps you from buying “best of the worst.”
- Compute a moving average, like 50-day.
- Require price above the moving average.
- Optionally require the moving average slope positive.
- Re-check after today’s close.
This is how you dodge mean-reversion traps that look strong for one week.
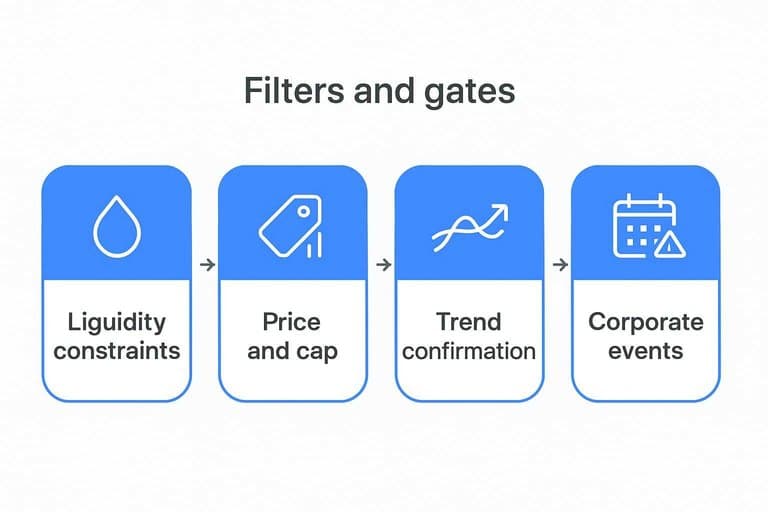
Corporate events
Corporate events create discontinuities that RS can’t interpret correctly. Earnings gaps, splits, special dividends, and mergers can spike returns without reflecting durable demand.
Many screeners flag event risk windows or pause scoring for a few sessions after a major event. Others exclude names with pending mergers or apply adjusted prices to neutralize split math.
Treat event jumps as “data with a story,” not pure momentum.
Why results differ
Two screeners can both claim “relative strength” and still output different tickers each day. The differences usually come from small implementation choices that compound fast.
Different choices change what you measure, who qualifies, and when you rebalance.
| Choice | Option A | Option B | Daily list impact |
|---|---|---|---|
| Lookback window | 3 months | 12 months | Faster vs steadier |
| Return type | Price only | Total return | Dividends change ranks |
| Benchmark | S&P 500 | Sector ETF | Rotations look different |
| Universe | All US stocks | Liquid, tradable | Microcaps vanish |
| Rebalance timing | Prior close | Today’s open | Gaps reshuffle leaders |
If your “top 50” changes wildly, check timing, universe, and window first.
Common failure modes
A daily relative strength (RS) screener can look “objective,” then quietly lie to you. The failures below come from mechanics: data timing, ranking math, and survivorship effects.
- Using today’s close before it’s final
- Mixing adjusted and unadjusted prices
- Ranking thin, illiquid microcaps
- Letting single-day gaps dominate
- Ignoring universe and survivorship drift
If your top names change wildly by midday, your screener is reading noise, not strength.
Lock in a repeatable daily RS routine
- Set the objective and benchmark: define “outperformance,” pick the benchmark, and fix your lookback windows.
- Validate data before scoring: aligned calendars, correct universe membership, and corporate actions (splits/dividends) handled consistently.
- Compute returns and RS the same way every day: choose simple vs log, decide ratio vs difference/alpha, and (if used) blend multiple windows with fixed weights.
- Refresh and rank on a schedule: roll the window forward, account for the benchmark’s move, and apply filters (liquidity, price/cap, trend, event gates) before publishing the list.
- Monitor drift: when results differ from other screeners, compare inputs and definitions first—most “disagreements” are methodology, not signal.
Frequently Asked Questions
Turn Daily RS Into Watchlists
Building a reliable relative strength stock screener is only half the battle—doing the daily refresh, filters, and context checks consistently is where most traders lose time.
Open Swing Trading delivers daily RS rankings, breadth, and sector/theme rotation context across ~5,000 stocks so you can surface breakout leaders fast—get 7-day free access with no credit card.