Rising Insight: russell 2000 vs s&p 500 for swing traders
Discover how russell 2000 vs s&p 500 performance guides swing trading, rotation signals, and high-conviction setups.
At the heart of the Russell 2000 vs S&P 500 debate is a simple, powerful truth for traders: the Russell 2000 is the pulse of domestic economic health and risk appetite, while the S&P 500 is the barometer for global mega-cap stability and institutional confidence. For a swing trader, the leadership rotation between these two isn't just market noise—it's a clear signal of a major shift in the market's mood, offering a real edge if you know how to read it.
Decoding the Two Signals Driving the Stock Market
For any discretionary swing trader trying to make sense of the market, the interplay between the Russell 2000 (small-caps) and the S&P 500 (large-caps) is one of the most reliable indicators out there. It’s best to think of them as two different engines powering the economy. One is the engine for Main Street, and the other drives Wall Street’s global machine.
The S&P 500 is a juggernaut. It’s built on 500 of the biggest corporate giants, with a massive tech weighting that often exceeds 30%. Because these companies pull in roughly 40% of their revenue from overseas, the index is incredibly sensitive to global economic currents.
Then you have the Russell 2000. It's a completely different animal, composed of 2,000 smaller, scrappier companies. Its sector exposure is much more balanced across areas like healthcare and financials, and its revenue is almost entirely domestic. This makes it a much purer reflection of the U.S. economy's health. You can find a deeper dive into the composition of these major indices on Mezzi.com.
It’s this fundamental structural difference that creates actionable intel for us as traders.
Quick Guide to Russell 2000 vs S&P 500
To get straight to the point, here’s a high-level look at the differences that truly matter for active traders trying to decide where the market's energy is flowing.
| Attribute | Russell 2000 (IWM) | S&P 500 (SPY) |
|---|---|---|
| Market Focus | U.S. Domestic Economy ("Main Street") | Global Mega-Caps ("Wall Street") |
| Typical Environment | Risk-On, early economic recovery | Risk-Off, late-cycle stability |
| Company Size | Small-Cap (Under ~$10B) | Large-Cap (Mega-corporations) |
| Economic Signal | Indicator of domestic growth & credit conditions | Indicator of institutional confidence & global trends |
This table boils it down, but the real magic is in understanding the rotation between them.
Key Differentiators for Swing Traders
The core insight here is that leadership rotation between these two indices tells a story about market psychology. When the Russell 2000 starts to outperform the S&P 500, it's a huge tell. It signals a "risk-on" environment where traders and investors feel confident enough to bet on smaller, growth-oriented companies and a strengthening domestic economy. This is a classic open swing trading signal, where you align your strategy with emerging market strength.
On the flip side, when the S&P 500 is leading the charge, it usually means the market is getting defensive. Money flows into the perceived safety of established, blue-chip names—a classic "risk-off" move.
For a swing trader, understanding this dynamic is not just academic—it is a foundational element of strategy. It tells you whether to hunt for aggressive growth setups in small-caps or focus on stable trend-following plays in market leaders.
By tracking this divergence, you can align your trade selection with where the big money is actually flowing. This is where a data-driven process becomes your best friend. Tools like OpenSwingTrading are designed to quantify this very relationship, cutting through the noise to show you which index is truly in control. From here, we'll dig into exactly how to put these signals to work.
Unpacking the Market's DNA: Economic Sensitivity and Composition
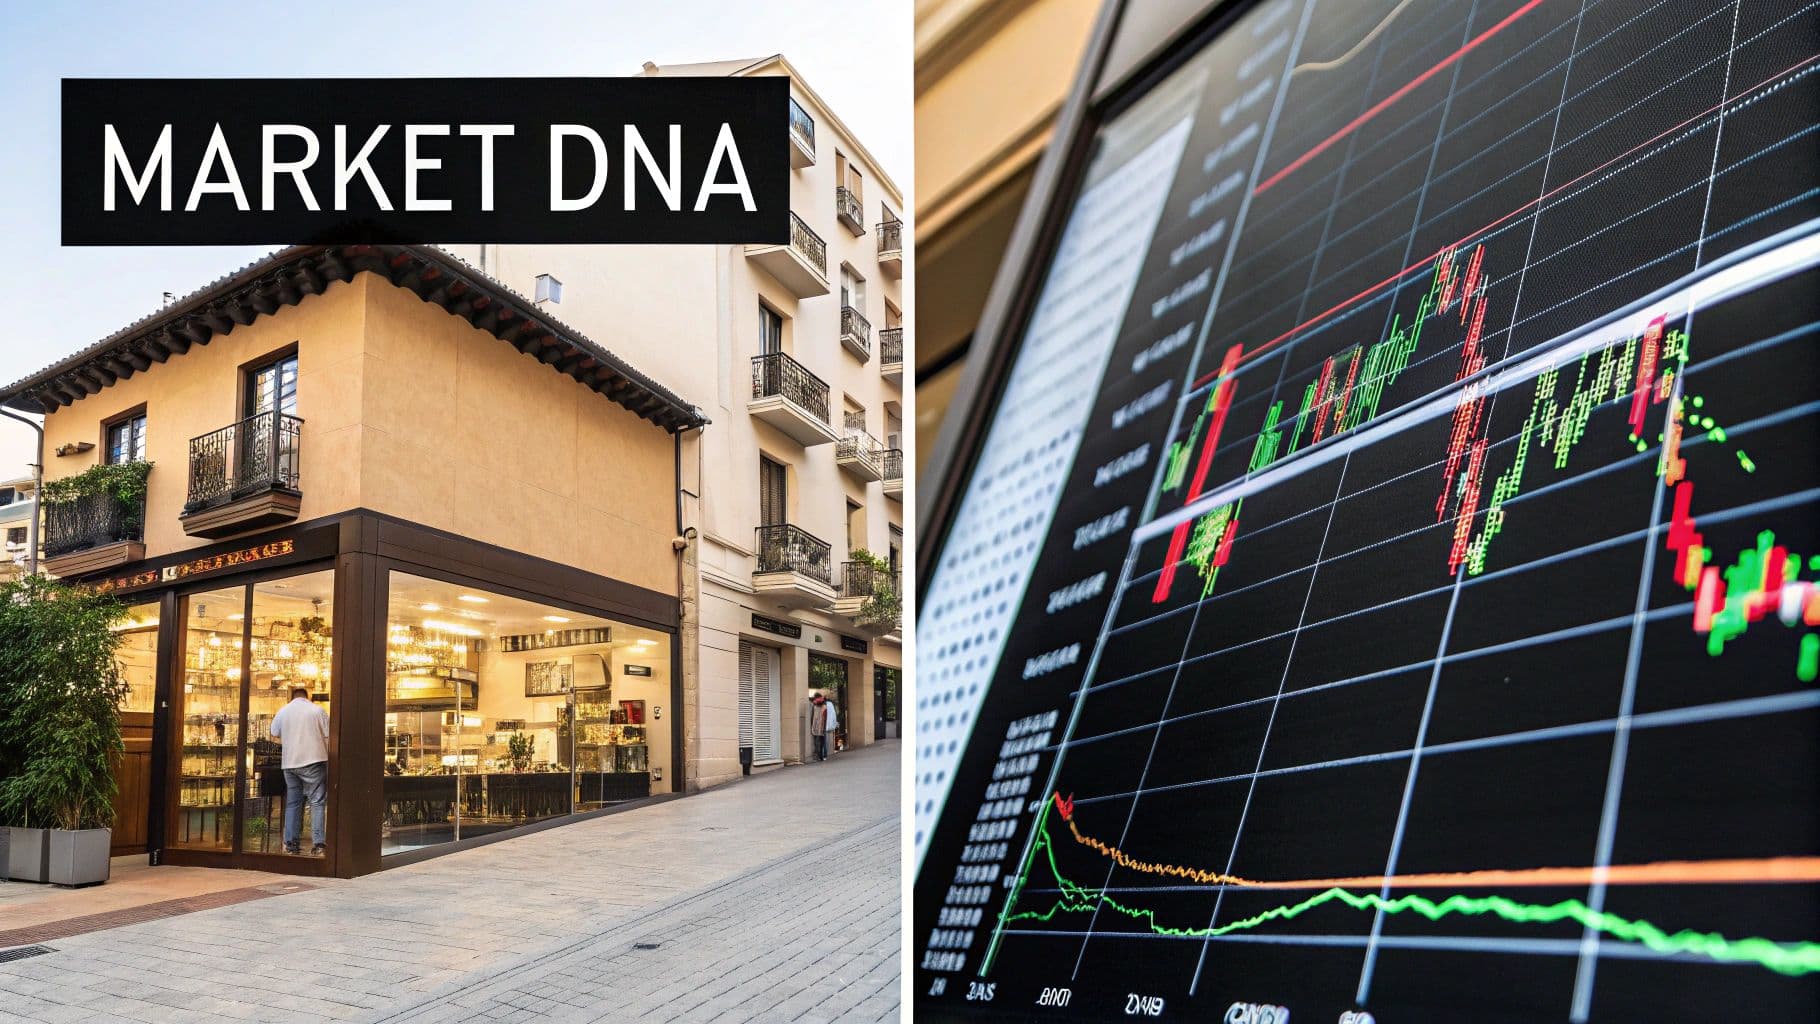
To really get a handle on the Russell 2000 vs S&P 500 relationship, you have to look under the hood. It’s about more than just size. These two indices have fundamentally different genetic codes, which dictates how they respond to economic shifts. Grasping this difference is your edge in predicting market rotations and setting up profitable swing trades for 2026.
The S&P 500 is notoriously top-heavy. At any given time, a small handful of tech behemoths can make up over 30% of the entire index's value. This creates a huge concentration risk; the fortunes of just a few mega-cap stocks can drag the whole market up or down, often hiding widespread weakness simmering below the surface.
These giants are also global players, pulling in massive chunks of revenue from overseas. This international exposure makes the S&P 500 a reflection of global macroeconomic trends, currency wars, and geopolitical drama. It tells you more about the health of multinational corporations than it does about the U.S. domestic economy.
The Russell 2000: A Pure Play on the US Economy
The Russell 2000, on the other hand, is a whole different beast. It’s a broadly diversified index of 2,000 smaller companies spread across sectors like financials, industrials, and healthcare. No single group has an outsized influence here.
Think of the Russell 2000 as a direct barometer of the American economy. With nearly 80% of its companies' revenue generated right here in the U.S., its performance is welded to the health of the American consumer, small business confidence, and regional economic currents. It’s a much cleaner signal of what’s happening on "Main Street."
For swing traders, this distinction is everything. The Russell 2000 often acts as a canary in the coal mine for the domestic economy, reacting first to shifts in U.S. interest rate policy or changes in consumer spending.
Since smaller companies lean more heavily on credit to fuel their growth, their fate is directly tied to what the Federal Reserve is doing. A dovish Fed can light a fire under small-caps, while a hawkish, tightening cycle can hit them disproportionately hard. This sensitivity is what makes the Russell 2000 such a valuable forward-looking indicator for traders.
What Each Index Tells You About the Market Cycle
These structural differences explain why each index takes the lead at different points in the economic cycle. The Russell 2000's close ties to domestic credit conditions and economic green shoots often make it a leading indicator. When small-caps start outperforming, it’s a classic sign that investors are getting hungry for risk and betting on stronger domestic growth to come.
In contrast, the S&P 500 tends to show its strength late in the cycle. When economic uncertainty creeps in or global growth sputters, big institutional money flees to the perceived safety of blue-chip mega-caps and their stable cash flows. This "flight to quality" can keep the S&P 500 looking strong even as the broader market is running out of steam.
This dynamic gives us a simple but powerful framework:
- Russell 2000 Leadership: This signals an early-cycle, risk-on environment. It's your cue to start hunting for aggressive growth and momentum stocks among the small-cap leaders.
- S&P 500 Leadership: This suggests a late-cycle, defensive posture. Your focus should shift to more stable, trend-following setups in established large-cap names.
By understanding the unique DNA of each index, you can stop just reacting to headlines. You can start anticipating the market’s next big move by seeing which economic engine—the global giants or the domestic workhorses—is firing on all cylinders.
When Small Caps Lead and When Giants Dominate
The relationship between the Russell 2000 and the S&P 500 isn't a fixed one; it's a cyclical dance driven by the economy. For any swing trader hoping to anticipate market rotations in 2026, understanding these historical cycles is crucial. Leadership between these two indices really boils down to one thing: risk appetite. And that appetite is almost always a direct result of the Federal Reserve's actions, the direction of interest rates, and where we are in the broader business cycle.
If you can learn to spot these patterns, you can start positioning your trades with the market's dominant theme instead of constantly fighting against it. The trick is to see these shifts not as random noise, but as predictable reactions to economic changes.
For a swing trader, this historical context is a powerful roadmap. It helps you recognize recurring patterns and decide whether to focus your energy on high-beta small caps or the more stable large-cap leaders. This isn't about perfectly timing the market; it's about aligning your strategy with the prevailing flow of institutional capital.
Early Cycle Recoveries: The Small-Cap Sweet Spot
Small caps, the heart of the Russell 2000, absolutely thrive in a specific environment: early-cycle economic recoveries. When the Federal Reserve cuts interest rates to wake up a sluggish economy, it’s like injecting pure liquidity into the system. This cheap capital makes it much easier for smaller, growth-hungry companies to borrow money, invest in new projects, and expand their operations.
This kind of environment lights a fire under investor risk appetite. Traders and institutions alike suddenly become much more willing to bet on the high-growth potential of smaller firms, anticipating that a domestic economic rebound will benefit them most. As a result, capital pours into the Russell 2000, often causing it to surge well ahead of the S&P 500.
This isn't just a theory; it's a pattern we've seen play out time and again. Just look at the recovery after the Global Financial Crisis (from January 2008 to March 2014). The Fed slashed rates to near-zero, and that injection of cheap money fueled a massive risk-on rally where the Russell 2000 outpaced the S&P 500 by a stunning 28.2%. You can dig deeper into this benchmark performance in research from S&P Global.
Late-Stage Bull Markets: A Flight to Quality
On the flip side, the large caps in the S&P 500 tend to take the lead during the late stages of a bull market or during periods of economic jitters. As the economic cycle matures, inflation often starts creeping up, forcing the Fed to raise interest rates to cool things down. This tightening of credit hits the smaller, often debt-reliant companies in the Russell 2000 the hardest, squeezing their margins.
In this environment, investor psychology shifts from optimism back to caution. The market enters a "risk-off" phase. Capital flows out of speculative, high-growth small caps and into the perceived safety of established, blue-chip mega-corporations. These S&P 500 giants typically have rock-solid balance sheets, stable cash flow, and global reach, making them far more resilient to economic headwinds.
For swing traders, this leadership shift is a critical signal. When the S&P 500 starts outperforming the Russell 2000, it's a clear sign that the market is getting defensive. This is your cue to prioritize capital preservation and focus on stable, trend-following setups in market leaders.
By keeping a close eye on the Russell 2000 vs. S&P 500 relationship, you get a clear window into the market's underlying mood. An actionable framework for a swing trader in 2026 might look something like this:
- When Small Caps Lead: This is the time to hunt for high-momentum breakout opportunities in the Russell 2000. The market is clearly rewarding aggressive growth plays.
- When Large Caps Dominate: It's smart to shift to more conservative, trend-following strategies within the S&P 500. The market is prioritizing stability and quality.
This simple but effective approach, which you can track using platforms like OpenSwingTrading, helps you align your trades with the market's current phase, which can dramatically improve your odds of success.
A Swing Trader's Playbook for Market Rotation
Knowing the theory is one thing, but having a repeatable, data-driven process is what truly separates the consistently profitable traders from the pack. To really capitalize on the dynamic between the Russell 2000 vs S&P 500, you need a clear framework for spotting which index has the upper hand and—more importantly—how to act on it. The goal here is to build a simple but powerful 'if-then' model to guide your trade selection through 2026 and beyond.
This playbook isn’t about predicting the future. It's about aligning your trades with the market's dominant theme. By watching just a handful of key indicators, you can systematically decide whether to hunt for aggressive small-cap leaders or stick with stable large-cap giants. This is how you integrate the principles of open swing trading into your daily routine, making high-conviction decisions backed by objective data, not gut feelings.
Identifying the Market's True Leader
First things first: you have to get a clean read on who's in charge. Chasing headlines or listening to the noise on financial news is a surefire way to get chopped up. Instead, we'll use a few core metrics to see exactly where the institutional money is flowing.
This decision tree gives you a great visual for how macroeconomic factors, especially Federal Reserve policy, tend to push one market segment ahead of the other.
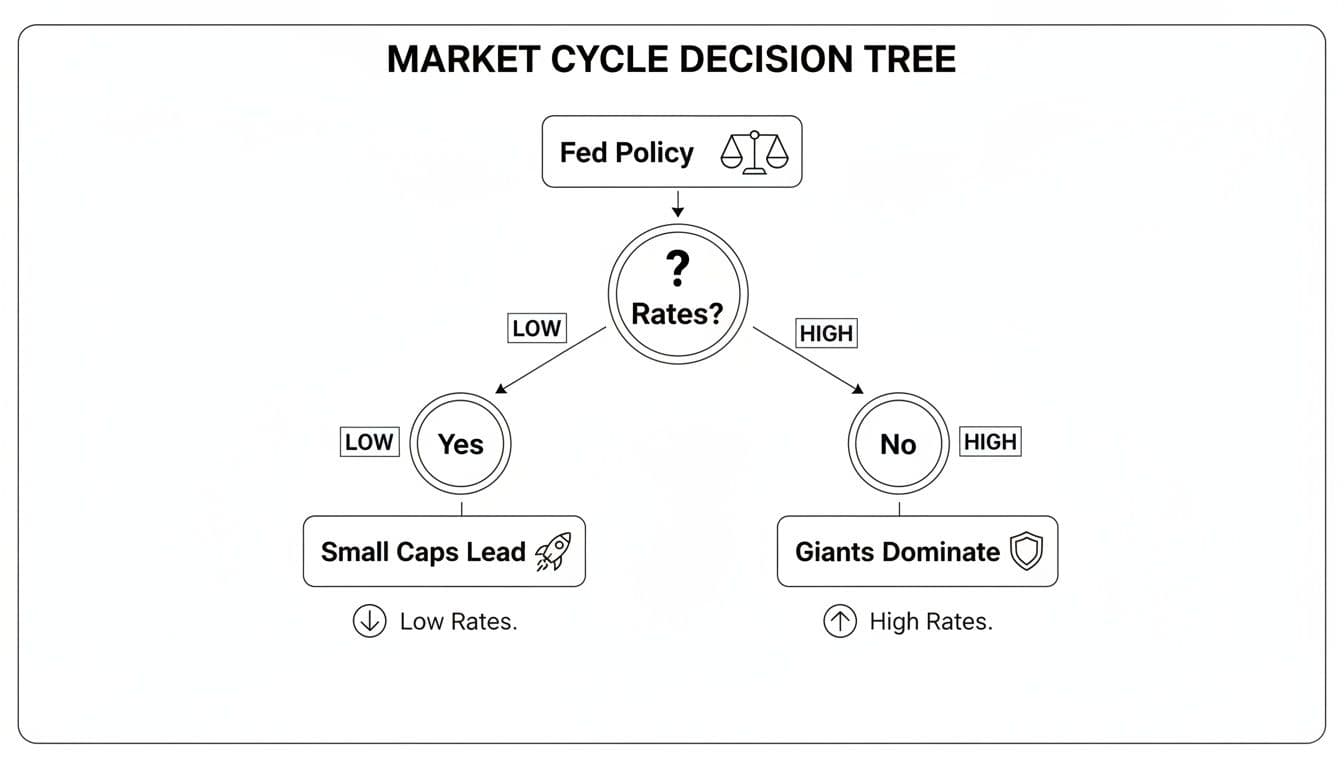
The big takeaway? Lower interest rates tend to spark a risk-on appetite for small caps, while higher rates often send investors running to the perceived safety of large-cap industry leaders.
One of the most powerful tools for this analysis is the IWM/SPY ratio chart. This simple chart pits the Russell 2000 ETF (IWM) directly against the S&P 500 ETF (SPY). It cuts right through the noise.
- A rising ratio means small caps are outperforming. This is a classic "risk-on" signal.
- A falling ratio means large caps are winning the fight. This points to a "risk-off" or defensive market posture.
By simply pulling up this ratio on a daily or weekly chart, you get an immediate visual on the market's underlying trend. This isn't just a lagging indicator; it's a real-time reflection of where capital is moving, and it can help you position for the next major rotation.
A Practical Checklist for Actionable Insights
Once you have a high-level view of market leadership, the next step is to confirm that signal with other data points. A checklist approach is perfect for this—it takes the emotion out of the equation and ensures your analysis is consistent and thorough.
Here’s a simple checklist to help you decide whether to favor Russell 2000 or S&P 500 setups. Think of it as your pre-flight check before you start hunting for individual trades.
Trader's Checklist for Identifying Market Leadership
| Indicator | Signal Favors Russell 2000 (Risk-On) | Signal Favors S&P 500 (Risk-Off) |
|---|---|---|
| IWM/SPY Ratio | In a clear uptrend, holding above its 50-day moving average. | In a clear downtrend, trading below its 50-day moving average. |
| Market Breadth | Strong advance-decline lines and a high percentage of stocks above key moving averages. | Weak advance-decline lines and a falling number of stocks holding in uptrends. |
| Sector Flows | Money is flowing into cyclical sectors like Industrials, Financials, and Technology. | Capital is rotating into defensive sectors like Utilities, Staples, and Healthcare. |
| Economic Data | Positive surprises in domestic reports (jobs, manufacturing, consumer sentiment). | Signs of a slowing economy or rising global uncertainty. |
This checklist is the foundation of your 'if-then' decision model. It’s simple, but it’s incredibly effective at keeping you on the right side of the market.
If the IWM/SPY ratio is in a firm uptrend, market breadth looks healthy, and money is flowing into cyclical sectors, then you should dedicate your charting time to building a watchlist of top-ranked small caps from the Russell 2000.
On the other hand, if the signals point toward large-cap dominance, your energy should shift to finding stable, trending names within the S&P 500. This data-driven process, which is the cornerstone of platforms like OpenSwingTrading, helps you filter out the distractions and focus your capital where the odds are stacked in your favor. It ensures you’re always fishing in the right pond.
Putting It All Together with OpenSwingTrading
Theory and checklists are great, but consistent execution is where the money is made. The good news is that folding the Russell 2000 vs. S&P 500 analysis into your daily routine doesn't have to be a grind. With a data-focused platform like OpenSwingTrading, you can boil this entire process down to a focused, 15-minute daily review that gets you ready for the opening bell.
This isn't about busywork; it's about filtering out the noise and keeping your emotions in check. When you systematically check the market's health, pinpoint leadership, and curate a watchlist, your charting time is spent only on the highest-probability setups. That's the core of what open swing trading is—using objective data to sharpen your trade selection and timing.
Your 15-Minute Daily Workflow
The goal here is to move from a 30,000-foot market view down to specific, actionable trade ideas, and to do it efficiently. This process makes sure you’re always trading in sync with the market's dominant personality, whether that’s the risk-on aggression of small-caps or the risk-off defensiveness of large-caps.
Let's walk through a simple, three-step routine for 2026.
Step 1: Get a Quick Read on Overall Market Health (5 Minutes)
Before you even think about individual stocks, you need to know if you're swimming with the current or fighting it. First things first: check the platform's primary market health indicators. These give you an instant read on the market's internal strength and risk appetite.
- Market Breadth: Are more stocks going up than down? A healthy advance-decline line tells you the rally has broad support.
- New Highs vs. New Lows: In a strong market, you'll see a growing list of new 52-week highs. A spike in new lows is a serious warning sign.
- Index Trend Strength: Are the major indices, including the S&P 500 and Russell 2000, holding above their key moving averages? This confirms the primary trend is intact.
This initial check tells you whether to be aggressive or to tighten your stops and pull back on exposure. It sets the entire tone for your trading day.
This five-minute health check is your first line of defense. If the overall market is sick, it doesn't matter how perfect an individual stock chart looks—the odds are stacked against you. This discipline alone will save you from countless frustrating losses.
Step 2: Analyze Capital Flows to Confirm Leadership (5 Minutes)
Once you've got a feel for the market's general health, the next question is: where is the money going? This is where the Russell 2000 vs. S&P 500 comparison really shines. You'll use the platform’s tools to see which index has the upper hand in relative strength and which sectors are attracting institutional money.
This step validates the signals from your checklist. You're looking for hard evidence that capital is either flowing into cyclical, risk-on sectors (which favors the Russell 2000) or retreating to defensive, risk-off areas (favoring the S&P 500). A quick scan of the sector and industry group rankings will give you the clarity you need.
Step 3: Build a Targeted Watchlist of Leaders (5 Minutes)
Now for the final step: building your watchlist. Based on the leadership you just uncovered, you’ll focus your hunt on the outperforming index. This is where OpenSwingTrading's volatility-adjusted relative strength rankings become incredibly useful.
- If Small-Caps Lead: Filter the entire market down to only the top-ranked stocks in the Russell 2000. These are the names showing the most powerful momentum.
- If Large-Caps Dominate: Tweak your filter to isolate the highest-ranked stocks within the S&P 500.
This data-driven method hands you a short, potent list of candidates. Instead of wasting time scrolling through hundreds of charts, you can now apply your technical analysis skills to a pre-qualified list of market leaders. This blend of quantitative screening and discretionary charting is the real power of open swing trading—it lets you focus on execution with confidence.
Frequently Asked Questions for Swing Traders
When you're trying to read the market's next move, the relationship between the Russell 2000 and the S&P 500 can be a goldmine of information. But it also brings up some common questions, especially as traders prep their playbooks for 2026. Let’s tackle a few of the big ones.
Which Index Is More Volatile and How Does That Affect Swing Trading?
Hands down, the Russell 2000 is the more volatile of the two. Small-cap stocks are just more sensitive to economic news, market rumors, and shifts in investor mood, which translates to much bigger price swings.
For a swing trader, that volatility is a classic double-edged sword. On one hand, it means a well-timed trade in a Russell 2000 stock can deliver explosive returns in just a few days. But on the other hand, the risk gets dialed way up, so you have to be on your game with risk management.
When you're playing in the small-cap arena, precise position sizing and hard stop-losses aren't just a good idea—they're non-negotiable. The S&P 500, with its lower volatility, tends to offer smoother, more predictable trends, which might be a better fit if you're aiming for a less bumpy ride or just have a lower tolerance for risk.
Can I Trade the Indices Directly Instead of Individual Stocks?
Absolutely. In fact, many seasoned traders focus exclusively on trading the indices through their ETFs—IWM for the Russell 2000 and SPY for the S&P 500. It’s a great way to bet on the market's overall direction without the headache of single-stock news or earnings surprises.
A powerful technique here is to watch the IWM/SPY ratio chart, which is a pure measure of relative strength.
- When the ratio is rising, small-caps are outperforming. This might be a signal to go long IWM.
- When the ratio is falling, the big guys are in charge. This would favor a long position in SPY, or for more advanced traders, a pairs trade where you go long SPY and short IWM.
This kind of macro-level analysis is at the heart of the open swing trading philosophy. You're trading the big, obvious rotations in the market, not just trying to pick individual winners.
How Do Interest Rates Specifically Impact the Russell 2000 vs. S&P 500?
Interest rates hit both indices, but they hit small-caps much harder. Think about it: many of the companies in the Russell 2000 are growth-oriented and rely heavily on debt to fund their expansion and day-to-day operations.
So, when the Federal Reserve starts hiking rates, the cost of that debt goes up, and it can directly crush the profit margins of these smaller companies. On the flip side, a low-rate environment is like pouring gasoline on a fire for small-caps, making capital cheap and encouraging the kind of risk-taking that fuels massive rallies.
The blue-chip giants in the S&P 500 are generally better insulated. They're sitting on massive piles of cash and have stronger balance sheets, making them far less dependent on short-term loans. While they certainly feel the effects of a broader economic slowdown from rate hikes, the direct financial pinch isn't nearly as severe.
Ready to stop chasing noise and start following the money? OpenSwingTrading gives you the data-driven tools to identify market leadership, find high-momentum stocks, and trade with confidence. Start your free 7-day trial today and see the market with new clarity.