Set Up a Trading-Day Tracker in Google Sheets
A hands-on guide to building a trading-day tracker in Google Sheets—from planning your calendar and data sources to generating a holiday-aware trading schedule, importing daily prices, tracking trades/holdings, and calculating reliable daily P&L and returns.
If your “daily performance” sheet breaks every time there’s a market holiday, a ticker changes, or you add a late trade, you don’t have a tracker—you have a fragile spreadsheet.
In this guide, you’ll set up a trading-day tracker in Google Sheets that behaves like a system: a settings-driven trading calendar, consistent price pulls with caching, a clean trades ledger that rolls into holdings by date, and a valuation grid that produces daily returns and P&L you can trust.
Plan the tracker
A trading-day tracker only works when “trading day” is unambiguous and repeatable. Decide your calendar rules, then pick data sources that match your workflow. For example, “NYSE close in America/New_York, no weekends, no US market holidays.”
Define trading calendar
Pick the exchange first, because it dictates holidays and early closes. Lock the timezone too, or your “daily” numbers drift when you travel.
Decide these rules:
- Exchange(s): NYSE, NASDAQ, LSE, crypto, or mixed
- Timezone: market local, or your local
- Weekends: always non-trading, or included
- Market holidays: exclude, or treat as “carry forward”
- Partial days: track early closes, or ignore
If you can’t say it in one sentence, your calendar will break later.
Choose data sources
Your source choice sets your reliability ceiling and your maintenance burden. Mix sources only if you also track “source of truth.”
- Use GOOGLEFINANCE for quick end-of-day prices
- Use manual inputs for fills, deposits, and adjustments
- Use API add-ons for broader coverage and faster refresh
- Standardize symbol formats, like “NASDAQ:MSFT”
- Respect rate limits, or cache results daily
When data breaks, you’ll debug the source, not the formula.
Create sheet structure
Start with separate tabs so each one has one job. Keep Settings boring and stable, because everything references it.
- Create tabs: Settings, Calendar, Prices, Positions, Dashboard.
- In Settings, store timezone, exchange, start date, base currency.
- Name ranges for key settings, like tz, exchange, start_date.
- Build Calendar from start_date, marking trading vs non-trading.
- Point Prices and Positions to Calendar dates, not “today.”
Once Calendar is solid, every other sheet becomes a lookup problem.
Build Settings tab
Set up one tab that controls the whole tracker. You will change values here instead of hunting formulas later.
- Create a new sheet named “Settings” and freeze row 1.
- Add labeled inputs: “Tickers”, “Start date”, “Timezone”, “Holiday calendar”.
- Put tickers in a vertical range, one per row, like “AAPL” or “MSFT”.
- Enter a start date using ISO format, like “2026-01-02”.
- Add dropdowns for timezone and holiday calendar using Data validation.
Treat this tab like your control panel; lock it down once it works.
Generate trading calendar
You need a trading calendar you can trust, because every metric downstream depends on it. In Sheets, WORKDAY and WORKDAY.INTL can generate only real sessions when you feed them a clean holiday range from Settings.
Holiday list range
Put all full-market closure dates on a dedicated Settings sheet, because formulas stay simple when the inputs are boring.
- Create a Settings tab with columns: Holiday Date, Holiday Name.
- Enter exchange closures as real dates, one per row.
- Add custom closures in the same list, even if rare.
- Keep early-close days in a separate table with a note.
- Name the closure-date column as a range, like Holidays.
Treat early closes as metadata, not “non-trading days,” or you will delete real sessions.
Trading-day formula
Generate the date spine first, because everything else can VLOOKUP against it.
- In Calendar!A2, store StartDate; in A3, store EndDate.
- In Calendar!B1, set headers: Index, TradingDate.
- In Calendar!B2, generate dates: =WORKDAY.INTL($A$2-1,SEQUENCE($A$3-$A$2+1),“0000011”,Holidays).
- In Calendar!A2, create an index: =SEQUENCE(ROWS(B2#)).
- If you need weekdays only, use WORKDAY instead of WORKDAY.INTL.
Once the spine is right, every “why is this off?” bug gets easier to isolate.
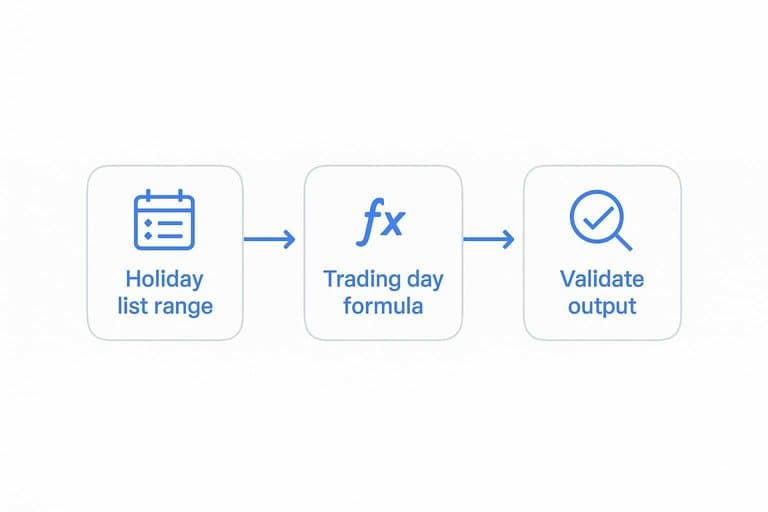
Validate calendar output
You want to catch one bad date now, not after you’ve built five charts on top of it. A quick spot-check beats debugging “phantom” gaps later.
Scan a known holiday week and confirm the closure date is missing but the adjacent sessions remain. Confirm your dates are local to your trading timezone, not your computer locale, then check the row for “today” highlights the expected session, especially around midnight.
If “today” highlights the wrong row, fix timezone and date parsing before you add any market logic.
Pull daily prices
You need one close price per ticker per trading day. Do it with GOOGLEFINANCE, but assume gaps, weekends, and flaky refreshes.
Ticker table setup
Keep tickers in a small table so every formula references one clean source. It prevents the classic “MSFT vs NASDAQ:MSFT” mismatch later.
- Store Symbol, Exchange, AssetType, DisplayName
- Build FullSymbol as Exchange&“:”&Symbol
- Add data validation on Symbol column
- Keep symbols uppercase, no spaces
- Freeze header row for edits
When the ticker table is boring and strict, your price grid stops breaking.
Price import pattern
Pull a historical range once, then index the close you need per day. It’s faster than calling GOOGLEFINANCE for every cell.
- In a helper sheet, call GOOGLEFINANCE(FullSymbol,“price”,StartDate,EndDate,“DAILY”).
- Wrap it with IFNA to return a blank when the feed fails.
- Use QUERY to keep Date and Close columns only.
- Use INDEX/MATCH to grab the close for each trading date.
- Return blank for missing dates, not zero.
If you see blanks on weekends, that’s correct data, not a broken formula.
Stabilize and cache
GOOGLEFINANCE recalculates more than you want. Use helper ranges and defensive wrappers so your sheet stays usable.
Put each ticker’s import in one dedicated helper block. Then reference that block from your tracker with IFNA and simple lookups.
For older periods, copy and paste values into an archive tab. Live data is for “now,” not for last quarter’s audit.
Track positions and trades
You need a clean trades ledger before you can trust holdings, P&L, or cost basis. Think of it like an accounting journal, not a “notes” sheet. One sloppy row like “AAPL buy 10-ish” will break everything downstream.
Trades ledger columns
Standard columns reduce ambiguity and make formulas boring. Boring is good.
| Column | Example | Type | Validation |
|---|---|---|---|
| Date | 2026-05-19 | Date | Must be date |
| Ticker | AAPL | Text | From tickers list |
| Side | BUY | Dropdown | BUY, SELL |
| Quantity | 10 | Number | Positive only |
| Price | 189.32 | Number | Positive only |
| Fees | 1.00 | Number | Zero or more |
| Notes | “earnings add” | Text | Optional |
If your ledger is strict, every other tab becomes easy math.
Holdings by date
You want end-of-day shares per ticker, for every trading day on your calendar tab.
- Create a Calendar sheet with one row per trading day.
- In Holdings, list tickers down and dates across from Calendar.
- Compute net shares with SUMIFS for BUY minus SELL up to each date.
- Copy the formula across all dates and down all tickers.
- Spot-check one ticker against the ledger for sanity.
When a number looks wrong, it’s usually a date filter issue, not “bad math.”
Cost basis approach
Pick one cost basis method and stick to it per account, or your history becomes nonsense. Average cost is the best first version because it stays stable and doesn’t require lot tracking.
For average cost, maintain two running totals per ticker: shares held and total cost. On a BUY, add quantity and add (quantity*price + fees) to total cost; on a SELL, reduce shares and reduce total cost by (avg_cost_per_share * quantity sold). That gives you a consistent cost basis and realized P&L without building a full lot engine.
Get average cost working first, then add FIFO when you actually need tax-lot accuracy.

Compute daily performance
You need daily performance that matches real trading days, not your memory of them. If you can’t trust the calendar, every “up day” becomes an argument.
Use your trading-day list as the spine, then hang valuation, P&L, returns, and drawdown off it. One clean grid beats ten scattered formulas.
Daily valuation grid
Build a grid that turns holdings and closes into one portfolio value per trading day. You want a single number you can chart and audit.
- Create columns: Date, then one column per ticker, then Total Value.
- For each ticker cell, compute Shares * Close for that Date.
- Use IFNA around the close lookup to avoid #N/A explosions.
- Sum across tickers into Total Value for each Date.
- Freeze the header row and the Date column for sanity.
If you can’t get this grid right, every “return” later is fiction.
Returns and P&L
Once you have daily total value, returns are just differences with guardrails. The first day is always the trap.
- Daily P&L: Today Total Value minus Prior Day Total Value.
- Daily Return: Daily P&L divided by Prior Day Total Value.
- First day handling: set P&L and Return to blank or 0.
- Cumulative Return: (Total Value / First Day Value) minus 1.
- Drawdown: (Total Value / Running Max Value) minus 1.
The drawdown line tells you risk in one glance, not in hindsight.
Quality checks
Sheets break quietly, then you celebrate fake performance. Add checks that scream when inputs drift.
Add a reconciliation row like “Total Shares” and “Total Value” so you can spot jumps. Create a Missing Price flag per day, like “MISSING” when any ticker close is blank. Use conditional formatting to highlight negatives, big swings, and any missing-price rows.
If your sheet can’t self-diagnose, you’ll debug it during the next market drop.
Make it runnable, then make it reliable
- Lock in your Settings tab: timezone, trading venue/calendar, holiday list, tickers, and start/end dates.
- Verify the trading calendar first (spot-check a known holiday and the next/previous sessions) before wiring any performance formulas.
- Add prices next, then freeze volatility: use a consistent import pattern and cache/stabilize values so recalcs don’t rewrite history.
- Only then track trades and compute performance—run quality checks (missing prices, negative cash/positions, and reconciliation to end-of-day holdings) each time you extend the date range.
Frequently Asked Questions
Does a trading day include pre-market and after-hours sessions, or only regular market hours?
Usually it means the regular session (e.g., 9:30 a.m.–4:00 p.m. ET for U.S. stocks), not pre-market or after-hours. If you want extended-hours tracking, you’ll need a separate timestamped price source because GOOGLEFINANCE typically reflects regular-session data.
How can I track trading days for multiple exchanges (NYSE, LSE, TSE) in one Google Sheets calendar?
Create a separate trading-day calendar per exchange using that market’s holiday list and timezone, then map each ticker to the correct calendar. This avoids mislabeling days when one market is open while another is closed.
How do I handle half trading days and early market closes in a trading day tracker?
Treat them as valid trading days in your calendar and add an “early close” flag from an exchange schedule (e.g., NYSE holiday calendar). Use that flag for annotations and reporting, even if your daily close-based calculations stay the same.
How accurate is GOOGLEFINANCE for daily close prices on a trading day, and when does it update?
It’s often accurate for end-of-day tracking but can lag or revise, especially around market close and corporate actions. For audit-level accuracy, compare against your broker’s fills or a dedicated data API (e.g., Alpha Vantage, IEX Cloud, Polygon).
What should I do when my trading day tracker breaks because of stock splits, ticker changes, or delistings?
Maintain a ticker mapping table (old ticker → new ticker, effective date) and adjust historical shares for splits using split ratios from your broker statements or a corporate-actions feed. For delistings, freeze the last valid close and record a manual exit value so performance math remains consistent.
Upgrade Your Trading-Day Workflow
Once your trading-day tracker is built, the real challenge is feeding it fresh leadership and market-regime context without adding hours of manual scanning.
Open Swing Trading delivers daily relative strength rankings, breadth, sector/theme rotation, and actionable filters so your Sheets tracker starts each day with better candidates—get 7-day free access.