Set Up stocks by industry in TradingView
A step-by-step guide to setting up stocks by industry in TradingView—build a consistent workspace, choose a clean taxonomy, create scalable industry watchlists, use screener presets, compare industries with relative strength, and automate alerts across groups.
If your watchlist is a single, endless mix of tickers, it’s easy to miss what’s actually moving—an industry trend, a rotation signal, or a breakdown spreading across peers.
This guide shows you how to organize TradingView around industries so you can scan faster and act with more confidence. You’ll set up a repeatable layout and templates, pick a practical classification system, build watchlists that scale, use screener presets for clean universes, create comparison views for strength and breadth, and automate alerts that fire for whole groups—not just one chart.
Define the workspace
You’re building a repeatable workspace, not a one-off chart. The goal is simple: every industry list, scan, and chart should “feel” identical when you flip symbols.
Pick your plan
Plan choice controls how many industries you can track at once without constant pruning.
| Feature | Free | Essential | Plus/Premium | |—|—|—| | Watchlist limits | Low | Higher | Highest | | Alerts | Limited | More | Most | | Multiple watchlists | Basic | Better | Best | | Screener access | Basic | More filters | Most filters |
If you maintain 10+ industries, limits become friction, not “preferences.”
Create a dedicated layout
A dedicated layout keeps your grids and sync settings stable across sessions.
- Create a new layout and name it “Industries.”
- Choose a 1–4 chart grid based on your screen size.
- Enable sync for Symbol and Interval across all panes.
- Enable sync for Drawings if you mark levels.
- Save the layout and pin it to your favorites.
Once sync is on, your review becomes a loop, not a scavenger hunt.
Standardize chart template
A template prevents indicator drift and keeps comparisons fair across peers.
- Set candles and add Volume.
- Add moving averages you trust, like 20/50/200.
- Remove anything you don’t use weekly.
- Save as a template named “Industry Base.”
- Apply it by default when you open new symbols.
Boring is good. Boring ships. Boring makes relative strength obvious.
Set default sessions
Session settings change what “support” and “breakout” even mean. If one chart shows extended hours and another doesn’t, you’re comparing different markets.
Set your timezone, regular vs extended hours, and your preferred currency. Keep those settings consistent in charts and screeners so a peer group move isn’t a settings artifact.
When peers diverge, you want it to be real price action, not a hidden toggle.
Choose an industry taxonomy
In TradingView, “industry” can mean whatever the platform labels today, or whatever you define and keep stable. Pick one definition and one source, or your watchlists will drift over time.
TradingView fields
TradingView already assigns Sector and Industry, so you can group stocks fast inside the Screener and symbol pages. For example, one exchange may show “Software” while another shows “Application Software.”
If you rely on TradingView labels, stick to one region and primary listing when possible. That keeps your filters and saved screens predictable.
External classifications
A standard taxonomy keeps your categories stable across brokers, regions, and time. Pick one, then map it once to TradingView labels so you can repeat the same grouping later.
- Choose one standard: GICS or ICB
- Export your tickers to a spreadsheet
- Add Sector and Industry columns
- Create a TradingView label mapping
- Version the mapping by date
Your watchlist becomes a dataset, not a vibe.
Handle edge cases
Edge cases make classifications noisy, which breaks backtests and comparisons. Set rules early, like “use the primary revenue driver,” and write them down.
For conglomerates, classify by largest segment, not the brand you recognize. For ADRs and dual listings, classify the operating company once, then apply it to every listing.
When a provider reclassifies a stock, keep the old tag until your next scheduled rebalance. That’s how you stop a stock from bouncing between groups.
Build industry watchlists
One watchlist per industry makes scanning fast, especially on volatile days. You stop hunting for tickers and start spotting patterns, like “Software is green, Semis are red.”
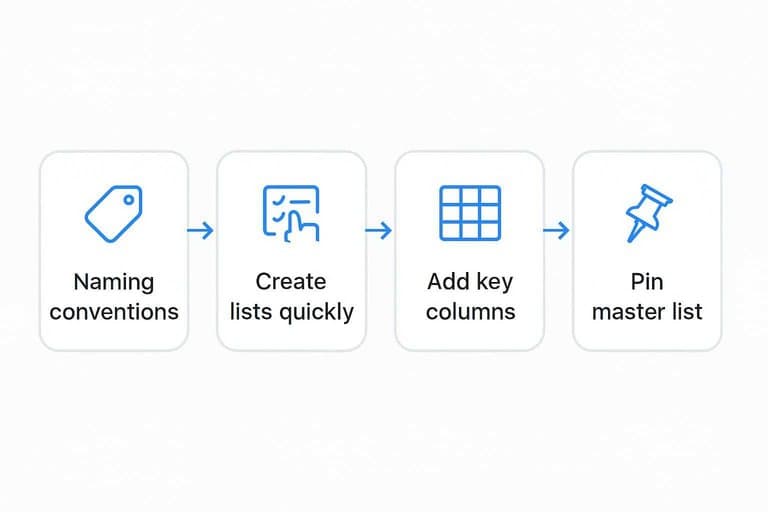
Naming conventions
Good naming turns search into a reflex, not a task. You want your lists to sort cleanly and autocomplete instantly.
- Use
SEC-Technologyfor sector-level lists - Use
IND-Softwarefor industry-level lists - Keep one separator, like
-, everywhere - Sort names alphabetically, always
- Mirror names across devices and workspaces
If your list names don’t autocomplete, your system is too clever.
Create lists quickly
Building lists manually is slow and error-prone. Use TradingView’s existing surfaces to capture tickers where you already work.
- Open a Screener view and filter to the industry.
- Select results and add them to the matching watchlist.
- Copy/paste tickers into a watchlist when you have a source list.
- From any chart, use “Add to watchlist” for one-off adds.
- Repeat per industry, then add the same symbols to your master list.
Speed matters because your list should track the market, not last quarter.
Add key columns
Columns turn a watchlist from a roster into a dashboard. Pick fields that answer, “What’s moving, and is it real?”
- Open the watchlist menu and choose “Columns.”
- Add
% Changefor instant trend direction. - Add
VolumeandRelative Volumefor participation. - Add
Market Capto separate whales from noise. - Add
52W Rangeplus pre/post-market columns when available.
When your columns are consistent, your eyes learn the layout and your decisions get faster.
Pin your master list
Keep one catch-all list for daily scanning, then drill down into industries when something pops. Name it something obvious like “Master-All Stocks,” and keep it pinned near the top.
Use color tags for quick intent, like “leader,” “laggard,” and “watch.” The tag is your promise to review it later.
Your master list is the inbox; industry lists are where you do the real work.
Use the Stock Screener
TradingView’s Stock Screener is the fastest way to keep industry watchlists current without manual ticker hunting. You build repeatable presets, then rerun them weekly to catch new listings and remove dead liquidity. Think “same filters, fresh output,” like a saved search called “US Semis – Liquid Midcaps.”
Create screener presets
Save one preset per industry so your lists refresh in minutes, not hours.
- Open Stock Screener and set your exchange and country.
- Add market cap and average volume filters for your segment.
- Set the Industry filter to one industry only.
- Add a price filter to exclude sub-dollar names.
- Save the layout as a named preset, like “Industrials – Large Cap Liquid.”
Name presets by segment first, industry second, so you can reuse the structure.
Liquidity rules
Liquidity filters keep you out of “looks good, can’t trade” charts, especially in small caps. Use simple proxies you can apply consistently, then tighten them for larger size.
A practical baseline:
- Minimum price: $5 for small caps, $10+ for large caps.
- Minimum average volume: 500k for small caps, 1–2M for large caps.
- Avoid thin ADRs by filtering to primary exchanges when possible.
If you need limit orders on every entry, your liquidity filter is too loose.
Export and refresh
Treat exports like a weekly diff between “what qualifies now” and “what you’re watching.”
- Run the preset and export tickers to CSV.
- Compare the CSV to your current industry watchlist.
- Add new qualifiers and tag them by industry.
- Remove symbols that fail liquidity or listing criteria.
- Recheck the top 10 charts for obvious misclassifications.
Your edge is a clean universe, not a bigger one.
Add basic fundamentals
Fundamental filters turn “the whole industry” into a tradable, higher-quality subset.
- Require positive EPS growth YoY
- Require revenue growth over 1–3 years
- Cap debt-to-equity below a set level
- Filter for positive free cash flow
- Exclude extreme valuation outliers
Do this after liquidity, or you’ll optimize numbers on untradeable tickers.
Create industry comparison views
You need the same “camera angle” on every industry, or you’ll confuse noise for leadership. Build a repeatable view: one benchmark, one industry proxy, and a few key names. When the layout stays constant, your conclusions get sharper.
Benchmark symbols
Pick one clean proxy per industry, plus a broad benchmark for context. Fewer symbols. Better decisions.
- Use one sector ETF per bucket (XLK, XLF, XLE)
- Add an industry ETF when needed (SMH, KRE, XBI)
- Keep one market benchmark (SPY or VT)
- Add one rates proxy if relevant (TLT)
- Add one dollar proxy for exporters (DXY)
If you keep swapping benchmarks, you’re measuring opinions, not performance.
Multi-chart layout
A small grid beats ten tabs because comparisons become instant. Use the same timeframe and the same cursor everywhere.
- Open a 2–4 chart layout in TradingView.
- Set Chart 1 to the industry ETF and Chart 4 to SPY or VT.
- Set Charts 2–3 to the top two constituents.
- Turn on Sync interval and Sync crosshair.
- Save it as a layout preset per industry.
When the crosshair lines up, leadership stops being a guess.
Relative strength setup
Relative strength is easier to trust when it’s visual and consistent. A ratio chart like “NVDA/SMH” or “SMH/SPY” shows who is winning, even in down markets.
Use a second pane for the ratio, or swap the symbol to a ratio ticker, like “AAPL/XLK”. Keep one RS view per chart, or it turns into indicator soup.
Outperformance with ugly price action is often the earliest rotation signal.
Breadth quick checks
Price leaders can hide weak participation. Breadth tells you if the industry move has a team behind it.
- Track screener count above 50D MA
- Track screener count above 200D MA
- Use advance/decline proxy within the industry list
- Watch new 20D highs vs lows
- Compare % up on the day vs benchmark
If only two names are working, you’re looking at a trade, not a trend.
Automate alerts by industry
You want alerts that fire for a whole industry, not just one ticker. Done right, you’ll catch “semis breaking out” before you notice NVDA moving.
Alert templates
Reusable templates keep your industry alerts consistent across dozens of symbols. Otherwise, you’ll end up with “close > high” on one chart and “crossing” on another.
- Breakout: close above prior range high
- MA cross: 20 EMA over 50 SMA
- RSI regime: above 60, below 40
- Volume spike: volume above 2x average
- Notes: premise, timeframe, invalidation
Consistency beats cleverness when you’re comparing leaders.
Set alerts efficiently
Setting alerts one-by-one is how good systems die. Batch them like you batch watchlist work.
- Add the alert from the chart using your saved condition.
- Name it with an industry prefix, like “SEMI | NVDA | Breakout”.
- Duplicate the alert and swap the symbol to the next leader.
- Use a multi-chart layout to cycle symbols fast.
- Review the alerts list to confirm timeframes match.
Speed matters because your process has to survive busy weeks.
Industry-level alerts
Alerting only on stocks is late, because leaders take turns. Alert the industry proxy and the relative trend first.
A simple setup works: alerts on the industry ETF, plus an alert on the ratio like XLF/SPY or SMH/SPY. When the ratio breaks out, the group is gaining strength even if headlines are quiet.
That’s how you spot rotation before your favorite ticker shows it.
Notifications routing
Alerts are useless if they land in the wrong place or look identical. Route by urgency, and name so you can act in seconds.
- Use push for urgent entries and stops.
- Use email for daily or end-of-day triggers.
- Use webhook for bots, dashboards, or Slack relays.
- Standardize names: “INDUSTRY | TICKER | TRIGGER | TF”.
- Add action text like “watch for pullback entry”.
Clear routing turns alerts into decisions, not noise.
Turn Your Industry Setup Into a Daily Routine
- Open your dedicated layout and apply your standardized chart template so every symbol is comparable.
- Start in your pinned master industry list, then jump into the specific industry watchlist you’re reviewing today.
- Run your saved screener preset to refresh the universe (liquidity + fundamentals), then export/update the watchlist.
- Check your industry comparison view (benchmarks, relative strength, breadth) and let your industry alert templates handle the rest while you focus on execution.
Frequently Asked Questions
Is TradingView’s “Industry” the same as “Sector,” and which one should I group stocks by?
No—sectors are broader categories, while industries are more specific groupings inside a sector. Most traders track both: industries for precision and sectors for big-picture rotation and risk.
Do I need a paid TradingView plan to track stocks by industry effectively?
Usually, yes if you want multiple watchlists, more alerts, and more layouts working at once. Free plans can work for a small number of industries, but you’ll hit limits quickly as your coverage grows.
How do I measure which industry is leading the market in TradingView?
Use relative strength by comparing an industry proxy against a benchmark like SPY or QQQ, and confirm with breadth signals such as % of members above the 50/200-day moving average. Leaders typically show rising RS plus improving breadth at the same time.
How often should I refresh my stocks-by-industry lists to keep them accurate?
Update weekly for active trading and at least monthly for swing/position tracking. Re-check after earnings seasons and major index rebalances, when liquidity and classifications often change.
What can I use if TradingView doesn’t provide the exact industry classification I want?
Build a custom industry taxonomy using third-party classifications like GICS, ICB, or NAICS and maintain it with a master spreadsheet or Google Sheet. Then mirror that structure in TradingView watchlist names so your “stocks by industry” views stay consistent.
Find Breakout Leaders Faster
Building industry watchlists and comparison views is powerful, but keeping leadership and rotation context updated daily is what makes it actionable.
Open Swing Trading tracks daily relative strength, breadth, and sector/industry rotation across ~5,000 stocks so your TradingView workflow starts with the right candidates—get 7-day free access with no credit card.