A Trader's Guide to Standard Deviation in Stocks
Learn how to use standard deviation in stocks to measure risk, understand volatility, and make smarter trading decisions with this practical guide.
When you hear "standard deviation" in the context of stocks, it's just a statistical way of measuring how much a stock's price has bounced around its average. Think of it as a tool for putting a number on volatility.
A high standard deviation means the price has been all over the map—wild swings up and down. A low one tells you the stock has been much calmer and more stable. For a swing trader navigating the markets in 2026, getting a grip on this concept is non-negotiable for managing risk and spotting real opportunities. This actionable insight is a cornerstone of effective swing trading, allowing you to turn market noise into a distinct advantage.
Understanding Volatility: Your Edge in the Market
For a lot of traders, the word "volatility" conjures images of market chaos and gut-wrenching uncertainty. But if you're a data-driven swing trader, volatility isn't something you run from; it's the very environment where your best trades are born. The flexibility of swing trading allows you to capitalize on these swings, whether up or down, without being glued to your screen all day.
Instead of seeing it as random noise, think of standard deviation as a practical way to map out a stock's typical behavior. It essentially draws a boundary around the stock's 'normal range of motion'—showing you how far its price is likely to wander from its recent average on any given day.
Mastering this is foundational. It bleeds into every single decision you make, from where you place your stop-loss to how much money you put on the line. A stock that swings wildly needs a completely different game plan than one that trades in a tight, predictable range.
Transforming Volatility into Opportunity
The whole OpenSwingTrading philosophy is built on moving past simple chart patterns and using hard data to quantify risk and find the best setups. This is how you turn volatility from a vague threat into a measurable, tactical advantage.
Here’s how that mental shift plays out:
- Quantifying Risk: You stop guessing and start measuring just how erratic a stock truly is. This lets you manage risk with precision, like setting a stop-loss just outside the zone of normal price chatter.
- Improving Stock Selection: By comparing the standard deviation of different stocks, you can zero in on candidates that actually fit your risk appetite and trading style. This is a key benefit of swing trading—you choose the setups that match your comfort level.
- Enhancing Timing: Knowing a stock's typical volatility helps you gauge the potential size of its next move, which sharpens both your entry and exit timing.
For the prepared trader, volatility isn't the enemy. It's the fuel. The trick is learning to measure it, respect it, and use it to your advantage instead of letting it catch you by surprise.
By weaving standard deviation into your daily analysis, you start building a smarter, data-informed workflow. The goal is to make objective decisions grounded in statistical reality, not gut feelings or market hype.
This is the bedrock of the OpenSwingTrading approach, designed to fit into a quick 5-15 minute daily routine. It gives you the critical context needed to trade effectively in 2026 and helps you focus only on the highest-probability setups where the big money is flowing.
How to Calculate and Visualize Standard Deviation
Understanding the concept of standard deviation is one thing, but the real lightbulb moment comes when you see how it's calculated and what it looks like on a chart. Don't worry, this isn't a math lesson. It's about building a gut feel for what those numbers on your screen are actually telling you.
The entire calculation is just a formal way of measuring the 'spread' in a stock's recent price action. A high number means the stock is wild and making big swings. A low number means it's been trading in a tight, predictable range. For swing traders in 2026, this single number is a powerful snapshot of a stock's personality.
The Simple Math Behind the Measure
Let's walk through the calculation with a quick example. It's surprisingly straightforward. Imagine a stock had these five closing prices over a week: 100, 102, 99, 103, and $101.
Here’s how we’d find its standard deviation:
- Find the Average Price: First, we need a baseline. Just add the prices and divide by five. (100 + 102 + 99 + 103 + 101) / 5 = **101**. This is our mean.
- Calculate the Variance: Next, we figure out how far each day's price was from that $101 average, square that difference (this just makes all the numbers positive), and then find the average of those squared results. This intermediate step gives us a number called the variance.
- Take the Square Root: Finally, we take the square root of the variance. Why? This brings the number back into a scale we can actually use—dollars and cents. This final result is the standard deviation.
That's it. This number now represents the typical distance a closing price was from the average over that period. A bigger number means more volatility—and for a swing trader, that often signals more opportunity, but also more risk.
This is how smart traders move past the raw emotion of fear. By understanding and quantifying volatility, they find their edge.
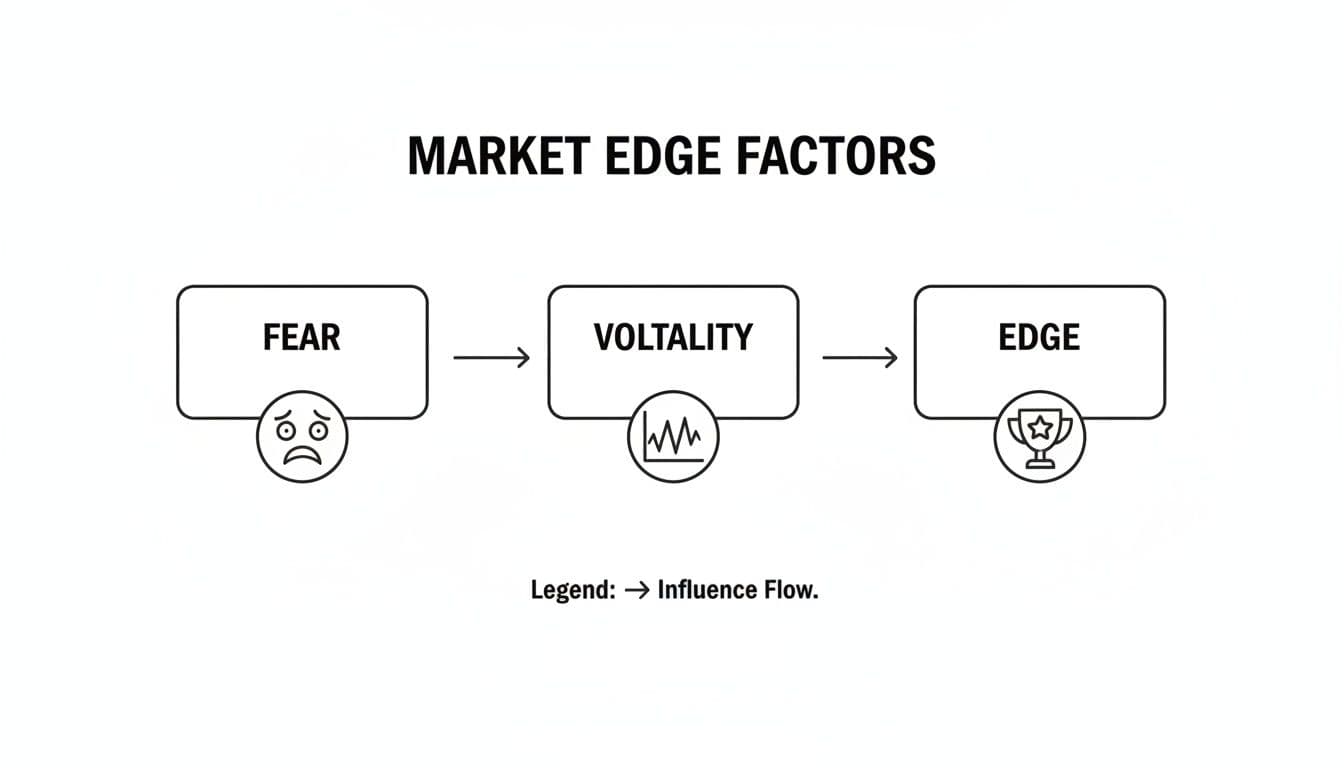
This simple flow captures the essence of a professional trading mindset: turning market noise into a measurable advantage.
Visualizing the Bell Curve on a Stock Chart
The real magic happens when you throw this on a price chart. Standard deviation is the engine behind indicators like Bollinger Bands, which essentially draw a 'bell curve' of probabilities directly over a stock's moving average. This creates an immediate visual guide to a stock's expected trading range.
Here’s what those bands tell you at a glance:
- One Standard Deviation (1SD): Statistically, a stock’s price will trade within one standard deviation (above or below) of its average about 68% of the time. Think of this as the zone of 'normal' behavior.
- Two Standard Deviations (2SD): The price stays within two standard deviations roughly 95% of the time. A move to the edge of this band is significant. It often signals a very strong trend or, conversely, a point of potential exhaustion.
- Three Standard Deviations (3SD): Moves beyond three standard deviations are exceptionally rare, happening less than 1% of the time. These are black swan events, usually triggered by huge earnings surprises, buyouts, or major market shocks.
By overlaying these statistical bands on a chart—a standard feature in platforms like TradingView—you can instantly see if a stock's current price is 'normal' or if it's making a statistically unusual move.
For anyone following the OpenSwingTrading methodology, this visualization is invaluable. It gives you a data-driven framework for setting profit targets and stop-losses. If your stock is screaming higher and bumping its head on that second standard deviation band, you know with high probability that it’s getting stretched. That might be a perfect, non-emotional reason to take some profits.
This is how you shift from guesswork to a process grounded in probability—a massive leap forward for any serious trader.
Why Stock Returns Aren't Perfectly Normal
The bell curve is a beautiful, clean model for understanding risk. It gives us a mental picture of price movements as neat, predictable, and symmetrical—most days are average, and wild swings are exceptionally rare. It’s a great starting point, but the real market, especially in 2026, plays by a different set of rules. For disciplined swing traders, respecting this reality is non-negotiable.
The truth is, stock returns don't follow that perfect bell curve. In the wild, extreme events—those face-ripping rallies and gut-wrenching crashes—happen far more often than the textbooks suggest. This is one of the market's dirtiest little secrets, and ignoring it is probably the fastest way to blow up your trading account.
Meet the Market's Fat Tails
There's a technical term for this phenomenon: leptokurtosis. It sounds complicated, but it just means the distribution of market returns has a sharper peak and "fatter tails" than a normal curve.
- A Sharper Peak: This means that on most days, prices actually move less than predicted, clustering tightly around the average. It's this calmness that can lull traders into a false sense of security.
- Fatter Tails: This is where risk management becomes critical. The "tails" of the curve represent the big, outlier moves. In the real market, these tails are much thicker, meaning that 2, 3, or even 5+ standard deviation moves (often called "sigma events") show up way more frequently than a pure statistical model would lead you to believe.
Think of it like predicting hurricane season. A statistical model might tell you a Category 5 storm only happens once a century. But if you’ve lived through a few active seasons, your gut tells you that severe storms are a much more common threat. The stock market is the same; it's wired for more frequent, high-impact events than the math would have you believe.
The history of the S&P 500 proves this point. Between January 3, 1950, and July 31, 2012, the index had an average daily return of just 0.03% and a standard deviation of 0.98%. A perfect bell curve would predict that about 68% of trading days fall within that one standard deviation range. The actual number? A whopping 95.6%. That's leptokurtosis in action: most days are incredibly quiet, but lurking just around the corner are the extreme moves that define a trader's career. You can see a full breakdown of these sigma events in market history to get a better feel for it.
How OpenSwingTrading Prepares You for Outliers
So if rare events aren't actually that rare, how do you trade? You have to stop looking at a single stock's volatility in a vacuum and start seeing the bigger picture. This is a core idea behind the OpenSwingTrading platform. Rather than being caught off guard by a sudden market shock, our whole approach is designed to help you navigate these unpredictable tail risks.
A trader's job isn't to perfectly predict the future but to be prepared for the range of possibilities. Understanding that the market has fat tails is the first step toward building a truly robust risk management plan.
We do this by focusing on the broader market health and where institutional money is flowing. When you understand the dominant forces at play—whether it’s a “risk-on” environment where everyone is buying or a “risk-off” panic where they're running for the exits—you can better anticipate when the odds of a violent move are rising.
This gives discretionary swing traders a huge edge. You’re no longer just staring at one stock's standard deviation. You're judging its volatility within the context of the entire market, which helps you know when to press your bets and, more importantly, when to pull back and protect your capital from the market’s inevitable surprises.
Putting Standard Deviation to Work in Your Trading
Knowing what standard deviation is is one thing, but making it work for you is where the real edge lies for swing traders in 2026. This is how we move from theory to practical strategies that genuinely sharpen your decisions and, most importantly, protect your capital. Instead of seeing volatility as something to fear, we can use it as a measurable tool to gain a tactical advantage.
Let's walk through four specific, practical ways you can put the standard deviation in stocks to work right now. These methods are designed to refine everything from how you pick stocks to how you exit a trade, creating a disciplined framework for navigating the market's inherent choppiness. Adopting this data-driven approach is a huge step toward building consistency in your trading.

Ranking and Filtering Stocks by Volatility
Let's be honest: not all high-momentum stocks are created equal. You could have two charts showing similar uptrends, but one might be a calm, steady climb while the other is a gut-wrenching rollercoaster. Standard deviation is the tool that lets you see the difference instantly.
Imagine you run a scan for stocks hitting new 52-week highs. By simply adding a standard deviation filter, you can immediately sort the erratic, jumpy names from the stable, true market leaders. It’s a simple but powerful step that can keep you from accidentally jumping into a trade that’s way more chaotic than you’re prepared to handle.
This is a cornerstone of the open swing trading philosophy—start with a wide universe of potential trades, then use hard data to whittle it down to only those that fit your personal criteria for both momentum and risk.
Smarter Position Sizing
One of the quickest ways to blow up an account is using the same position size for every single trade. Think about it: a 10,000** position in a sleepy utility stock carries a completely different level of risk than **10,000 in a speculative small-cap biotech. Standard deviation gives you a logical framework for sizing your trades based on a stock's actual personality.
The rule of thumb is simple: the higher the stock's standard deviation, the smaller your position size should be. On the flip side, for stocks with lower, more predictable volatility, you can take a larger position while keeping your dollar risk the same. This method, often called volatility-based position sizing, is a game-changer. It ensures that no single trade can inflict disproportionate damage on your account just because the stock was a wild mover.
This isn't just a neat trick; it's professional risk management. It forces you to risk less on unpredictable setups and allows you to commit more capital to trades that offer a smoother, higher-probability ride.
Setting Dynamic Stop-Losses
Where do you put your stop-loss? Too many traders fall back on arbitrary numbers, like a generic 8% rule. A much smarter approach is to let the stock's own volatility dictate where your stop should be.
By placing your stop just outside a stock's normal range of price movement—say, 1.5 or 2 standard deviations below your entry or a key moving average—you give the trade room to breathe. This simple adjustment helps you avoid getting shaken out by random price fluctuations, that frustrating "noise" that is a natural part of any trend.
Using a volatility-based stop-loss is like anchoring your boat far enough from the shore to avoid getting bumped by normal waves, but close enough to be protected from a major storm. It’s a data-driven buffer against market noise.
This strategy tailors your risk to the specific stock you’re trading. A volatile name gets a wider stop, and a stable one gets a tighter stop. It just makes more sense than a one-size-fits-all rule.
Volatility-Adjusted Relative Strength
Raw price momentum can be deceiving. A stock might be up 50% in three months, but if it took you on a terrifying journey to get there, was it truly a market leader? This brings us to one of the most powerful ways to use standard deviation: creating a risk-adjusted picture of performance.
This concept is a core pillar of the OpenSwingTrading platform. We don't just look for stocks going up the fastest; we find stocks that deliver strong returns with lower-than-average volatility. This uncovers true institutional leadership—stocks being steadily accumulated by big money, not just chased by retail speculators.
History shows us why this matters. Looking at long-term averages for large-cap stocks, the arithmetic mean return was 11.9% per year, but it came with a hefty standard deviation of 19.8%. That means roughly two-thirds of the time, annual returns fell somewhere between -7.9% and +31.7%. You can dig into the numbers yourself by reviewing the data on historical market returns and risk. This wide range highlights exactly why raw performance isn't enough.
By factoring in risk, we get a much clearer, more reliable signal of true market strength—and that’s the key to finding high-probability swing trading opportunities in 2026.
Weaving Standard Deviation into Your Daily Workflow
Knowing the theory is one thing, but actually putting it to work day in and day out is what separates the pros from the rest. It’s time to stop thinking about standard deviation as an abstract concept and start using it in a simple, repeatable routine that takes just 5 to 15 minutes a day.
This isn’t about creating some magic "black box" that just tells you what to buy. Think of this process as building a powerful context engine for navigating the markets of 2026. It's about developing a solid analytical habit that works hand-in-glove with your charting on platforms like TradingView. The goal is to get a real feel for the market before you even look at a single stock.
Let's walk through a practical, three-step daily process.
Step 1: Take the Market's Temperature
Before you even think about individual stocks, you have to know what kind of environment you’re stepping into. Is the market calm and welcoming to breakouts, or is it a chaotic mess that’s chewing up aggressive traders? The standard deviation of the major indices, like the S&P 500, is your best tool for getting a quick read.
When the index's standard deviation is low, it points to a stable, "risk-on" mood where trends have a good chance of continuing. On the flip side, a sudden spike in index volatility screams fear and uncertainty—a clear signal to tighten up and play defense.
Think of this as your first and most important filter. It tells you how aggressive to be and stops you from trying to force bullish trades when the market itself is falling apart.
Step 2: Follow the Big Money
Once you have a feel for the overall market, your next job is to see where the institutional money is headed. Big funds don't just sprinkle cash everywhere; they rotate into sectors and industry groups that show the most promise and stability.
The OpenSwingTrading platform is built to track this flow for you, showing which sectors are outperforming and, just as importantly, doing it with controlled risk.
Smart swing trading is about finding the strongest currents and swimming with them. By identifying the leading sectors, you dramatically increase the odds that the stocks you select have a powerful tailwind at their back.
For example, in a choppy market, you might see money rotate into defensive plays like utilities or consumer staples. When the bulls are running, that same money will likely pile into technology and discretionary stocks. This step is all about making sure you’re fishing in the right ponds.
Step 3: Pinpoint the True Market Leaders
Now for the final step: finding the best of the best within those leading sectors. This is where volatility-adjusted metrics really shine. Instead of just chasing whatever is moving fastest, we’re looking for stocks that offer the best return for the risk we’re taking.
Our platform’s rankings do this heavy lifting automatically. By surfacing stocks that have both high relative strength and relatively low standard deviation, we help you zero in on the true market leaders—the names that institutions are quietly accumulating.
This three-step workflow gives you a focused, high-probability watchlist every single day. Looking back at historical data, you can see just how much these volatility regimes matter. For example, U.S. stock price index volatility was 24.99% in 2021 and shot up to 26.74% during the 2020 pandemic chaos. That's a huge difference from the much calmer 15.49% in 2019 and 11.12% in 2018. As you can explore in more detail using FRED data, being aware of these shifts is critical.
By following this process, you’re using standard deviation to build crucial context, making your trading decisions in 2026 far more objective and data-driven.
Common Mistakes to Avoid When Using Standard Deviation
Standard deviation is an incredibly useful tool, but it's not a crystal ball. I’ve seen even the sharpest, most data-driven traders fall into a few common traps by misinterpreting what the numbers are telling them.
To make sure your analysis in 2026 is on point, you need to understand these pitfalls. Think of volatility metrics as one part of a complete trading system, not a standalone magic indicator. Let’s walk through three key mistakes I see traders make all the time.

Assuming the Past Predicts the Future
The single biggest mistake is treating historical volatility as a guarantee of future results. Standard deviation is purely a rear-view mirror metric; it’s calculated using past price data. It tells you how a stock has been moving, not how it will move tomorrow.
This becomes painfully obvious around major news events. A sleepy, low-volatility stock can turn into a wild ride overnight on a surprise earnings report or some unexpected industry news. While historical data gives you a solid baseline, it’s no substitute for active risk management. For us as swing traders, this just means we always have to be ready for a stock’s character to change on a dime.
Ignoring the Broader Market Context
Looking at a stock's volatility in a vacuum is a recipe for disaster. A standard deviation of 2.5% might feel terrifying for a utility stock but completely normal for a high-flying biotech. Context is everything.
You have to ask: is the entire market going wild, or is it just this one stock? A stock holding steady with low volatility while the rest of the market is in turmoil can be a huge tell—a sign of real strength and institutional support. This is exactly why the OpenSwingTrading workflow starts with an assessment of the overall market health before we even look at individual names.
Standard deviation is a piece of the puzzle, not the entire picture. It offers crucial data on risk, but a successful trading decision requires integrating that data with market health, sector strength, and sound chart analysis.
Relying on a Single Indicator
Finally, please don’t treat standard deviation as the one indicator to rule them all. It's fantastic for measuring risk and how scattered price action has been, but it should never be your sole reason for pulling the trigger on a trade. The best, highest-conviction trades come from a confluence of factors all lining up.
A solid trading plan layers volatility analysis with other tools like relative strength, price patterns, and volume analysis. Your goal is to build a complete case for every trade you take. This is what separates the pros from the amateurs—shifting from just chasing signals to carefully building context around every single setup. That's the real key to finding high-probability opportunities and achieving long-term consistency.
Common Questions About Using Standard Deviation in Your Trading
Even after you get the hang of the math, some practical questions always pop up when you start applying a new tool to your live trading. Let's tackle a few of the most common ones I hear to help you get started in 2026.
What's a "Good" Standard Deviation for a Stock?
This is a bit like asking "what's a good speed for a car?" It totally depends on where you're going and what you're trying to do. There’s no single magic number.
A sleepy utility stock might have a standard deviation under 1%, which is perfect if you’re looking for low-volatility stability. On the other hand, a high-octane tech name that swing traders love might jump around with a daily standard deviation of 3-4% or more. That volatility is where the opportunity lives.
The real power of standard deviation isn't in finding a "good" number, but in using it for comparison. It helps you rank stocks against each other and understand which ones are the wild rides and which are the slow movers.
How Is This Different from Beta?
Great question. It's a common point of confusion, but the distinction is critical. Both measure risk, but they look at it through different lenses.
- Standard Deviation measures a stock's total volatility. Think of it as the stock's own unique personality—how much it tends to bounce around its own average price, completely independent of what the broader market is doing.
- Beta measures a stock's market-related volatility. It tells you how a stock moves in relation to the S&P 500. A beta of 1.5 suggests the stock is, in theory, 50% more volatile than the market itself.
For swing traders setting stop-losses or sizing up a position, standard deviation is usually far more practical. It gives you a direct read on the stock's individual behavior, which is exactly what you need to manage your trade.
Can I Use This for Day Trading?
Absolutely, you just need to adjust your lens. A swing trader looks at a 20-day standard deviation on a daily chart to gauge volatility over weeks. A day trader would apply the exact same logic to a much faster timeframe.
For instance, you could use a 20-period standard deviation on a 5-minute chart. The principle is identical: you're measuring recent volatility to define what "normal" price movement looks like right now, which is perfect for spotting unusual intraday spikes or potential exhaustion points.
Stop chasing signals and start building context. OpenSwingTrading provides the data-driven framework to assess market health, follow institutional capital, and pinpoint true market leaders. Transform your trading in just 5-15 minutes a day. Start your free trial at OpenSwingTrading.