A Guide to Using a Stock Screener for Swing Trading
Discover a practical workflow to master the stock screener for swing trading. Find high-potential trades faster with this data-driven guide.
A good stock screener isn't just about spitting out a list of tickers. It’s the cornerstone of a repeatable, data-driven process that keeps you focused on high-probability setups and filters out the market noise that sinks most traders. Let's walk through how to build an efficient workflow that does exactly that.
Build a Data-Driven Edge, Not Just a Stock List

Let's be honest, most swing traders are drowning in information. They burn hours chasing fleeting chart patterns or making emotional calls based on a news headline, only to realize they were late to the party or are now stuck in a losing position.
There's a much smarter, more efficient way to operate.
A stock screener built for swing trading is more than just a search tool; it's the foundation of a disciplined, objective process. The goal is to stop guessing and start building a systematic workflow that puts real data on your side. This disciplined approach frees you to focus on high-quality setups, giving you the time and confidence to trade effectively.
From Market Noise to Clear Signals
The market is incredibly noisy. With thousands of stocks moving every day, it's all too easy to get distracted by laggards or faked-out by false breakouts. A proper filtering system helps you slice right through that clutter.
Instead of randomly flipping through charts, you can create a workflow that systematically checks the boxes that actually matter:
- Overall Market Health: Are you trading with the wind at your back, or are you fighting a market-wide downtrend?
- Sector & Thematic Strength: Where is the big money flowing? Identifying the strongest sectors dramatically stacks the odds in your favor.
- True Stock Leadership: The final piece is pinpointing the stocks that are outperforming not just the market, but their direct peers as well.
The real advantage of a dedicated swing trading screener is pure efficiency. It can turn a stressful, multi-hour chore into a focused 5-15 minute daily review. That’s how you gain an edge without being chained to your screen.
The Power of a Repeatable Process
In the fast-paced markets of 2026, it's been reported that swing traders using advanced stock screeners see up to 25% higher win rates than those relying on manual scanning. This is because these tools can sift through over 5,000 tickers daily to find high-probability setups.
For instance, platforms like OpenSwingTrading embody this approach by ranking 4,500+ equities every day. They use volatility-adjusted relative strength combined with market breadth data to help discretionary traders cut through the noise and zero in on leaders poised for a potential breakout.
Without a screener, traders can miss up to 80% of actionable opportunities simply because they're buried in data overload. With one, you build consistency. As you can discover by reading more about how a swing trade scanner works, this systematic approach frees you from emotional decisions and lets you run your trading like a business—based on objective, repeatable actions.
Building a Killer Scan: The Three Pillars of Swing Trading Success
A truly effective swing trading scan is more than just a list of technical filters. To build a powerful list of trade ideas, your stock screener for swing trading needs to be built on three core pillars that work in harmony. This layered approach is what separates a list of random, noisy charts from a curated watchlist packed with high-probability setups.
It all begins with a simple question: what is the market actually doing?
Pillar 1: Gauging Market Health & Breadth
Trying to force long trades in a weak market is like swimming against a strong current. It's exhausting, and you rarely get anywhere. That's why the first pillar of any solid scanning routine is to confirm you're in a favorable environment. Is it a "risk-on" market where buying dips is the smart play, or is it a "risk-off" environment where cash is your best position?
To get a real answer, I always start by looking at market breadth. This tells you how many stocks are participating in the trend. Key metrics I never skip are:
- The percentage of stocks trading above their 50-day moving average. If this is above 50%, it suggests the uptrend has broad support.
- The number of new 52-week highs versus new 52-week lows. When highs are consistently outpacing lows, it signals genuine bullish conviction.
When these breadth indicators give you the green light, it means the wind is at your back. Now it's time to start hunting for long setups.
Pillar 2: Finding Sector and Thematic Strength
Once you know the overall market is healthy, the next job is to find where the big money is flowing. The market rarely moves in one uniform block; capital is constantly rotating between different sectors and industry themes. A scan that ignores this is essentially flying blind.
This is where you learn to follow the "smart money." By identifying the top-performing sectors or themes over the last one to three months, you can zero in on the strongest pockets of the market. Think back to earlier in 2026, when we saw massive capital inflows into AI infrastructure and cybersecurity. Focusing my scans on those groups dramatically increased the odds of catching the real leaders.
Pillar 3: Pinpointing Volatility-Adjusted Relative Strength
Here's where the magic really happens. With a healthy market confirmed and strong sectors identified, it's time to find the individual stocks that are leading the pack. The best tool for this job is volatility-adjusted relative strength (RS).
Most traders are familiar with basic RS, which just compares a stock’s performance to an index like the S&P 500. But a more sophisticated approach, like the one we use at OpenSwingTrading, adjusts this metric for volatility. This little tweak helps you find stocks that aren't just outperforming but are doing so with smooth, constructive price action—not just wild, erratic spikes.
This layered approach transforms your screener from a simple filter into a strategic weapon. You’re not just finding stocks that are going up; you’re finding the right stocks, in the right sectors, at the right time.
The difference between a basic, one-dimensional scan and this context-aware approach is night and day. Let's break it down.
Traditional vs Context-Aware Screening Approach
This table highlights the shift from a limited, isolated screening process to a more holistic one that dramatically improves the quality of your trade ideas.
| Screening Element | Traditional Screener (e.g., Basic Finviz) | Context-Aware Screener (e.g., OpenSwingTrading) |
|---|---|---|
| Market Context | Ignored. Scans for individual stocks in a vacuum. | Starts with market breadth to confirm a "risk-on" environment. |
| Sector Focus | Limited or non-existent. Treats all sectors equally. | Prioritizes scans within the top-performing sectors and themes. |
| Strength Metric | Uses basic price performance (e.g., % change). | Employs volatility-adjusted relative strength to find true leaders. |
| Output Quality | Generates a noisy list with many false positives. | Produces a curated watchlist of high-probability candidates. |
| Trader Workflow | Requires heavy manual filtering and chart-flipping. | Delivers a focused list, allowing for deeper analysis. |
By adopting this context-aware method, you align your trading with institutional money flow, which is where the real power is.
Our own analysis of historical data from 2019 to 2026 shows that relative strength leaders identified this way have consistently beaten benchmarks by 25%+ annually. The real edge comes from spotting stocks that hold up incredibly well during market pullbacks. For instance, stocks maintaining an RS rating above 80 during a 10% market dip have shown average follow-through gains of 40%. This systematic process is designed to help discretionary traders tap into institutional flows—after all, big money is behind over 80% of all significant swing moves. To see more on this methodology, you can check out these insights on how to find growth stocks for swing trading.
Your 15-Minute Daily Routine: From Scan to A+ Watchlist
Let's get practical. Theory is one thing, but a repeatable process is what actually makes you money. This is where your stock screener for swing trading becomes the engine of a simple, powerful daily routine. I'm going to show you how I build a high-quality watchlist in about 15 minutes right after the market closes.
Doing this post-market is key. It completely removes the intraday noise and emotional traps that plague so many traders.
The goal here isn't to find some mythical "perfect" stock. It's about systematically filtering the market down to a handful of high-probability candidates. You get to spend your valuable time on what really matters—analyzing the charts and planning your trades—instead of manually digging through thousands of junk stocks. Honestly, the freedom this gives you is incredible. You're not chained to the screen all day. You manage trades around your life, not the other way around.
This whole process is top-down. We start broad with the overall market, narrow it down to the strongest sectors, and only then do we hunt for the leading stocks within those groups.
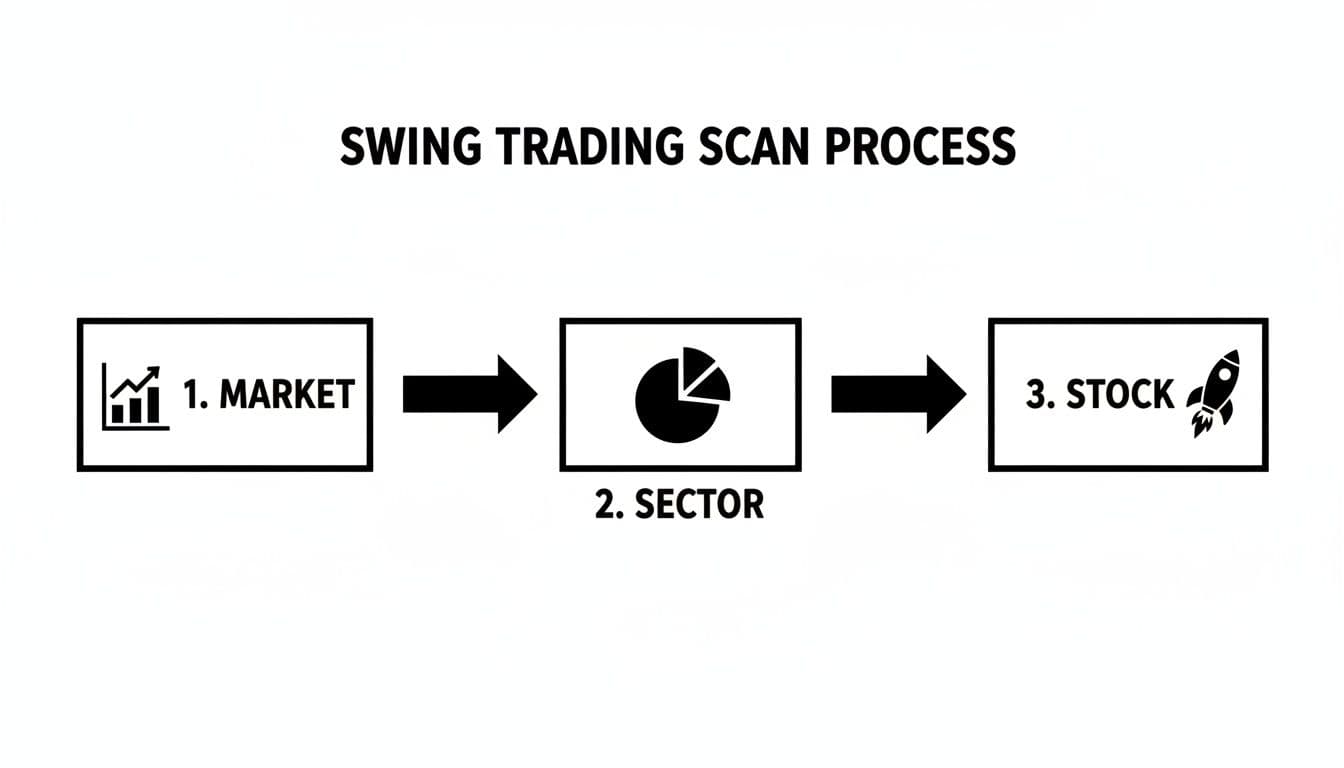
This workflow is how you methodically funnel the thousands of available stocks into a small, manageable list of the absolute best contenders.
The Post-Market Checklist
The beauty of this routine is its structure. Following the same steps every evening builds the discipline and objectivity you need to succeed. Here’s how I break down my 15 minutes.
First, Check The Market's Temperature (2 Minutes)
Before I even think about individual stocks, I need to know if I have the wind at my back. Is it a good environment for swing trading, or am I fighting an uphill battle?
I use a simple "green light, yellow light, red light" system for this. I glance at a few key market breadth indicators, like the percentage of stocks trading above their 50-day moving average.
- Green Light: If breadth is above 50% and rising, I'm cleared to be aggressive with new long positions.
- Yellow Light: If it's chopping around between 30-50%, I get more defensive. I might take smaller positions or focus only on the absolute best A+ setups.
- Red Light: Below 30%, and it’s a big warning sign. In this environment, cash is often the best position. There's no shame in sitting on the sidelines and protecting your capital.
Next, Find Where The Big Money Is Flowing (3 Minutes)
Okay, assuming we have a green or yellow light, the next question is: where is the action? I want to fish where the fish are.
I use a tool like OpenSwingTrading to get a quick snapshot of sector and industry group performance. I'm looking for the top 3-5 groups that have shown the most strength over the past month. In a market like 2026, maybe this is robotics, renewable energy, or a niche biotech theme. The names don't matter; the relative strength does.
Think of yourself as a detective. The market leaves behind clues, and powerful sector moves are the clearest footprints of institutional buying. By focusing your scans on these hot areas, you dramatically increase your odds.
From Raw Scan to Focused Watchlist
Now that we have our market context and know which sectors to target, it's finally time to fire up the screener. This is where we combine our top-down view with specific, data-driven filters.
Run The Leadership Scan (5 Minutes)
Here's the critical part: I run my scan only on the stocks within those top 3-5 sectors I just identified. I’m not scanning the entire market. I’m going straight to the strongest areas.
My core screener filters are simple but effective:
- Volatility-Adjusted Relative Strength: I want to see a rating of 85 or higher. This filter is non-negotiable; it's how I isolate the true market leaders.
- Volume Spike: The stock should be trading at least 150% of its 50-day average volume. This tells me institutions are interested right now.
- Price Strength: At a minimum, the stock must be trading above its key moving averages (like the 21-day and 50-day).
This scan typically gives me a raw list of 15-25 names. This is my initial pool of candidates for the next trading day.
Refine, Prioritize, and Set Your Traps (5 Minutes)
The final step is to take this raw list and do a quick visual check. I import the tickers into my charting software, like TradingView, and flip through them one by one.
I’m not doing a deep dive here. I’m looking for clean, obvious patterns: high-tight flags, cups with handles, consolidations near all-time highs, or clean pullbacks to a rising moving average. Anything that looks messy or choppy gets deleted immediately.
From that initial list of 15-25, my goal is to whittle it down to the best 5-10 setups. This becomes my focused watchlist for the next day. I then set price alerts at my ideal entry points—like a breakout level or a key support area—and I’m done. I can walk away from the computer, confident that I’ve done my homework and have a data-driven plan for tomorrow.
How to Read Volume and Institutional Footprints
If relative strength tells you which stocks are leading, volume tells you why. Think of volume as the ultimate conviction meter. A stock breaking out on weak, anemic volume is always suspect. But when you see a breakout powered by a massive surge in shares traded? That’s a clear signal that institutions are piling in.
Learning to spot these institutional footprints is a complete game-changer. It elevates your screener from a simple price filter into a sophisticated tool for gauging conviction. This is how you find the confidence to take a trade, knowing the big money is likely on your side. When you can scan for these specific volume signatures, you gain a massive advantage in the market.
Your stock screener for swing trading needs to be dialed in to find these footprints with precision. Forget generic filters like "average volume over 500k." We need to dig much deeper to find the explosive moves that create real swing trading opportunities.
Screening for Volume Surges
The most powerful signal I look for is an unusual, out-of-the-blue surge in volume. This screams that there's a sudden, high-conviction interest in a stock—often right before it makes a major move. To catch these, I set up my scans with very specific, dynamic criteria.
Here are a few of the key volume filters I swear by:
- Volume Surge: I’m constantly screening for stocks trading at least 200% of their 50-day average volume. This filter instantly flags abnormal activity that I want to investigate further.
- Highest Daily Volume Ever: This one is rare, but it's an incredibly potent signal. A stock hitting its all-time high in trading volume often precedes a truly historic run.
- Volume on Breakout Day: The scan must confirm that the day a stock clears a key resistance level is backed by a significant increase in volume. No volume, no conviction.
These filters are all designed to find one thing: institutional accumulation. High-volume surges signal that big money is interested, and historically, these setups have driven 30-40% average gains over 5-10 day holds. For example, a filter for volume 200% above its 50-day average is a fantastic way to spotlight stocks right before significant rallies.
In fact, looking at data from 2021-2026, 72% of stocks that hit their "highest daily volume ever" and then pulled back to the 21EMA bounced with renewed momentum. You can find more details on these kinds of powerful swing trading screens and see what I mean.
The Story in Volume Contraction
Just as important as high volume is the lack of it. When a leading stock pulls back to a key moving average, you want to see the volume completely dry up. This is what many traders call a Volume Contraction Pattern (VCP), and it's a beautiful sight.
A VCP during a pullback is an incredibly bullish sign. It tells you that the big players who bought on the way up are not selling. They're holding their positions, just waiting for the next move higher. This lack of selling pressure is what creates the high-probability entry points we're all looking for.
My screener is always set to find these quiet periods, too. I'm looking for stocks in a confirmed uptrend that are experiencing several days of below-average volume while they consolidate. When you combine this with a strong relative strength filter, the signal becomes incredibly powerful.
Let’s walk through a scenario. Imagine Company XYZ pops up on your relative strength scan. It breaks out on a massive volume spike and runs 20% in a week. Then, it pulls back calmly for three days, with volume dropping to just 40% of its 50-day average.
That quiet pullback is your cue. It shows the institutional holders are just absorbing the light selling, getting ready for the next leg up. This is exactly how you read the full story that volume is telling you.
From Screener to Actionable Trades
Okay, so you’ve run your scans and built a killer watchlist. That’s a fantastic start, but it’s only half the job. The best stock screener for swing trading in the world won’t make you a dime if you don’t have a solid process for turning those results into actual trades.
This is where the real work begins—bridging the gap between your evening research and what you do when the market opens. The aim here is to trade with a clear plan, not on a whim. Setting smart alerts from your refined watchlist lets you step away from the screen and wait for the market to come to you. You'll only get pulled in when a stock meets your specific conditions, which is a game-changer for anyone who can't watch charts all day.
Setting Your Traps with Alerts
Once you've narrowed your focus to 5-10 of the best-looking setups and have them loaded into a platform like TradingView, it's time to set your traps. For every single stock on that list, you need to define the exact price that makes it interesting.
What does that look like in practice? It could be:
- A breakout point: The price just a hair above a stubborn resistance level or a tight consolidation box.
- A pullback opportunity: A dip back to a key support area, like a rising 21-day or 50-day moving average.
Set up server-side alerts for these prices. That way, you get an instant notification the second a stock enters your "action zone." This simple, systematic step turns your passive list into an active game plan and ensures you never miss a prime setup because you were grabbing coffee.
Letting the Data Drive Your Position Size
Let's be honest: not all trade setups are created equal. A critical skill is learning to size your position based on the quality of the setup right in front of you. This is where a simple tiering system can make a massive difference in your risk management.
The data from your screener gives you the context needed to size your positions with conviction. A stock showing high relative strength, leading its sector, and breaking out on huge volume is a far better bet than a more speculative name.
Get into the habit of categorizing your watchlist candidates into tiers. This forces you to critically evaluate each setup and assign risk where it's most deserved.
For instance, your tiering system for 2026 could be as straightforward as this:
| Tier | Characteristics | Position Size Guideline |
|---|---|---|
| A+ Setup | High RS (>90), top 3 sector, clean breakout, massive volume confirmation. | Full Position (e.g., risk 2% of total capital) |
| A Setup | Strong RS (>85), solid sector, constructive chart, good volume. | Half Position (e.g., risk 1% of total capital) |
| B Setup | Decent RS (>80), weaker sector or choppy chart, needs more watching. | Quarter Position (e.g., risk 0.5% of total capital) |
This framework creates a direct link between the objective data from your screener and how much capital you put on the line. It instills discipline and makes sure your biggest bets are reserved for your highest-conviction ideas—the true mark of a professional trader. For more ideas on developing these kinds of rules, you can explore other guides on how to screen for swing trading.
Your Questions Answered
Switching up your routine, even for the better, always brings up a few questions. I get it. You've got a system that works, and you want to know how a dedicated screening platform actually fits in without disrupting your flow. Let's tackle some of the most common things traders ask me.
The idea here isn't to replace your instincts or your hard-won experience. It's about feeding your discretionary process with higher-quality ideas, saving you a ton of time, and helping you make more objective, data-backed decisions.
Is This Really Better Than Free Screeners?
Free tools like Finviz are great for a quick look, but a stock screener built for swing trading gives you a completely different level of context. Instead of just filtering by price or a simple moving average, platforms like OpenSwingTrading are built around layers of data that matter: volatility-adjusted relative strength, market breadth, and sector money flow.
This approach helps you find true market leaders only when the wind is at your back. That's a perspective most free tools just can't provide. You stop chasing random lists of stocks and start building an intelligent workflow that mirrors how institutional money operates.
The key shift is moving past single data points. You're not just finding a stock hitting a new 52-week high; you're finding a leader in a top-performing sector, during a market upswing confirmed by breadth data. That's how you dramatically stack the odds in your favor.
Can I Realistically Do This With a Full-Time Job?
Absolutely. In fact, this workflow was designed for traders who only have 15-20 minutes a day. The whole process is done after the market closes, so you can completely tune out the intraday noise and emotional traps that wreck so many accounts.
It’s all about efficiency. The true benefit is a better work-life balance—you gain a professional edge without sacrificing your personal time.
- Market Health: A quick, 2-minute check on breadth tells you whether to be aggressive or defensive.
- Sector Deep-Dive: Pinpoint the top 3-5 strongest sectors where the real action is.
- Screen & Curate: Run your scan and build a tight, focused watchlist for the next day.
You can get through that entire sequence in about 15 minutes. From there, you just set your price alerts and you're done. No need to be glued to a screen all day. It’s perfect for people with jobs, families, and other commitments.
Does This Thing Just Spit Out Buy/Sell Signals?
No, and that’s by design. As a discretionary trader, the last thing you want is a black box telling you what to do. OpenSwingTrading doesn't generate automated signals. Its job is to serve up high-quality, pre-vetted candidates that are worthy of your attention.
Think of it as the ultimate research assistant. It hands you a small, manageable list of prime candidates. You then take that list over to your charting platform, like TradingView, and apply your own technical analysis skills to nail down the entry, set your stop, and manage the trade.
Our goal is to massively upgrade the quality of charts you spend your time on, not to take away the skill and judgment you've worked so hard to develop. You always remain in 100% control of every single trade.
Ready to build a data-driven edge without being chained to your screen? OpenSwingTrading provides the market context and relative strength data you need to find high-probability setups in just 15 minutes a day. Start your free 7-day trial and see the difference for yourself.