Stocks by sector giving false leaders? Debug it
A practical troubleshooter for when “top sectors” keep showing the wrong leaders—confirm the symptom, validate prices/constituents/sector tags, audit ranking math and return windows, separate breadth from single-stock effects, and harden your signals with regime controls and robust scoring.
If your sector leaderboard keeps crowning “winners” that immediately roll over—or the same sector leads even when its charts look awful—your model may be rewarding noise, bad mappings, or a hidden weighting bug.
This troubleshooter walks you through a fast, repeatable debug path: reproduce the issue on demand, verify prices/splits and constituent histories, audit your return and weighting choices, and diagnose whether a single outlier stock is hijacking the sector score. You’ll finish with robust, benchmark-relative signals and sanity checks you can trust.
Confirm the Symptom
“False sector leaders” show up when your charts and ranks point to a winner, but the follow-through never arrives. You see a sector spike to #1, you rebalance, and a week later it’s dead last while a different sector leads. Expected behavior is smoother leadership with explainable rotations, not constant musical chairs.
What looks wrong
You’re not chasing normal rotation. You’re chasing noise that looks like leadership until you trade it.
- Sector ranks flip in one refresh
- Top sector underperforms next week
- Leaders differ across data sources
- Rebalances trigger whipsaw entries
- “Best” sector has thin breadth
If three or more hit at once, your leader signal is probably unstable.
Reproduce on demand
You need a repeatable failure, not a vibe. Make the problem show up on command.
- Choose a fixed date range and rebalance schedule.
- Run your sector ranking method and export all inputs.
- Save the outputs: ranks, scores, constituents, and weights.
- Refresh data, rerun, and compare ranks and scores.
- Repeat on a second date range to confirm the pattern.
If the same setup produces different “leaders,” you’re debugging data and math, not markets.
Set the expectation
A valid leader persists long enough to matter, not just long enough to print a green candle. You want improving relative strength, broad participation inside the sector, and turnover that matches your timeframe, like “monthly ranks shouldn’t reshuffle daily.” If your method expects stable leadership but your output behaves like a day-trading signal, the mismatch is the bug.
Check Data Integrity
False sector “leaders” usually come from dirty inputs, not clever factors. A single split missed in one ticker can make a whole sector look like it “broke out.”
Price and splits
Different vendors mix adjusted and unadjusted series, and ETFs often differ from their constituents. You want one return definition everywhere, or your leaders are noise.
- Pull both adjusted and unadjusted close for every symbol.
- Verify split factors match exchange records on split dates.
- Confirm dividend handling: price-return vs total-return series.
- Recompute returns from corporate actions, then compare to vendor returns.
- Cross-check ETF return vs holdings-weighted constituent returns.
If the ETF and the basket diverge on “quiet” days, your adjustments are wrong.
Constituent drift
Sector baskets are not static, even if your backtest treats them that way. Reconstitutions and delistings can manufacture strength by quietly removing losers.
The quickest test is a membership audit by date, not a spot check. Export daily constituents for each sector proxy, then flag days where weights or names change materially.
If performance jumps line up with membership changes, you’re measuring churn, not leadership.
Sector mapping errors
Sector labels drift, disagree, and sometimes lie. The same business can show up as two tickers, two sectors, or two countries.
- Compare GICS vs NAICS vs vendor “sector” fields
- Track reclassifications with effective dates
- Handle dual-class shares as one economic company
- Normalize ADRs to the primary listing
- Watch conglomerates with shifting revenue splits
If sector membership can change mid-sample, your “winner” may just be a relabel.
Missing and stale data
Missing prints and backfilled values cluster by venue, market cap, and region. That clustering can make one sector look smoother and “stronger.”
- Compute missingness per symbol per day, then aggregate by sector.
- Flag repeated closes and zero-return streaks beyond a threshold.
- Detect backfills by checking revision history or last-updated metadata.
- Identify halts and suspended tickers, then decide your fill rule.
- Compare last-updated timestamps across symbols and vendors.
If one sector updates later, your ranking is partly a clock problem.
Audit the Ranking Method
Your “leaders” can be an artifact of math, not market truth. The fastest way to find false leaders is to stress the ranking inputs, then see what breaks.
Example: a sector looks dominant on a 5D return, then disappears on 63D. That’s not leadership. That’s window luck.
Return window choice
Different return windows reward different behaviors, so your leaderboard can flip just from timing. You want to spot the window lengths that create maximum churn in your universe.
| Window | Typical leader type | Whipsaw risk | Common failure mode |
|---|---|---|---|
| 5D | news-driven movers | High | event noise dominates |
| 20D | momentum clusters | Medium | trend breaks flip rank |
| 63D | regime survivors | Low | late to new trends |
| 126D | cycle followers | Low | stale leadership persists |
If 5D and 20D disagree weekly, you’re ranking volatility, not leadership.
If you want a concrete example of how membership/weight changes can create churn, see what happens when stocks in an index change.
Equal vs cap weight
Your weighting scheme can manufacture winners, especially when one stock is the sector. A mega-cap jump can make an entire sector look like it led.
Example: cap-weight Tech leads because two names gapped up, while most constituents fell. Equal-weight would call that sector weak.
If the “leader” disappears under equal-weight, you found phantom leadership.
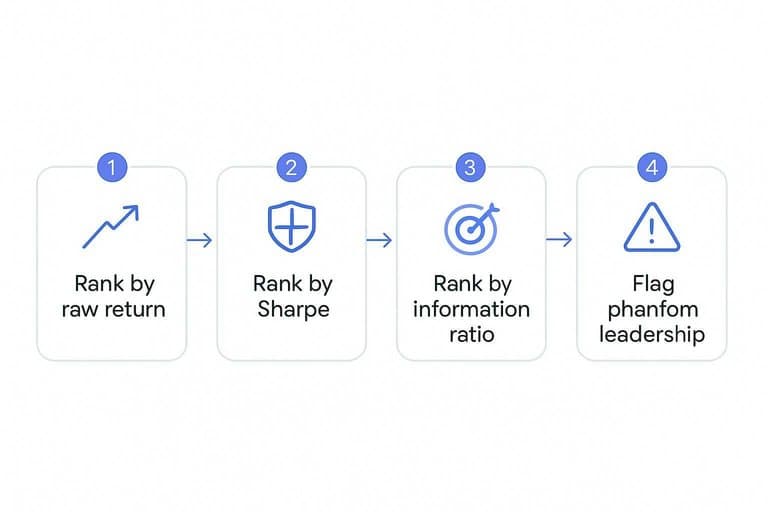
Volatility distortion
Raw return rankings often crown the noisiest sector, not the best one. Test whether the winners stay winners after risk adjustment.
- Compute sector returns and volatility for your ranking window.
- Rank by raw return, then rank by Sharpe on the same window.
- Rank by information ratio versus your benchmark, using excess returns.
- Flag sectors with top raw return but bottom-half Sharpe or IR.
- Re-run across multiple windows to confirm stability.
If a sector only wins on raw returns, you’re paying for chaos.
Lookahead leakage
Small alignment mistakes create perfect-looking leaders that never repeat live. You’re hunting for any input that knows the future.
- Ensure signal uses only t-1 data.
- Freeze constituents as of rebalance date.
- Use point-in-time fundamentals, not revised values.
- Confirm corporate actions are applied after the fact.
- Run a one-bar shift test: signal(t) must trade at t+1.
If shifting the signal by one day breaks results, you had leakage.
Separate Sector vs Stock Effects
Sector leadership often isn’t a sector. It’s two stocks in a trench coat.
You’re debugging one question: is the move broad, or just headline weight.
Breadth diagnostics
You need breadth numbers that don’t care about market cap. Then you can tell “many names working” from “one name screaming.”
- Compute each constituent’s return versus your benchmark return.
- Calculate % outperforming, advance/decline, and the median return.
- Pull the sector ETF return for the same window.
- Compare median and % outperforming to the ETF’s return direction.
- Flag “false leaders” when ETF is up, median is flat, and breadth is weak.
If the ETF is strong but the median is weak, you’re staring at concentration risk.
Top-5 concentration
You need to know who actually drove the sector ETF. Contribution math turns vibes into receipts.
| Metric | What you compute | Red flag | Interpretation |
|---|---|---|---|
| Top-5 weight | Sum of top-5 weights | 40% | ETF is top-heavy |
| Top-1 contribution | Weight × relative return | 50% of excess | Single-stock story |
| Top-5 contribution | Sum contributions | 80% of excess | Leadership is narrow |
| Residual breadth | ETF excess minus top-5 | Near zero | Rest did nothing |
When one or two names explain the excess return, “sector leader” is a labeling error.
Outlier handling
Outliers can be real leadership or pure noise from an earnings gap. Your choice changes what you call a “leader.”
Winsorization tames one-day spikes, but it can hide genuine breakouts. Median-based stats respect breadth, yet they underweight a true mega-cap move.
Use capped contributions when you care about stable signals, and raw contributions when you’re trading the reality of index weight.
Control for Market Regime
Sector “leaders” often show up during regime flips, then vanish when the macro impulse fades. You need to separate real relative strength from a temporary beta or factor bet, like “tech is leading” during a pure risk-on squeeze.
Beta and factor exposure
Estimate exposures first, because many sector winners are just leveraged proxies for the market or one style factor.
- Regress sector returns on market returns to estimate beta.
- Add factor returns: value, growth, momentum, quality.
- Flag sectors where beta or one factor explains most performance.
- Re-rank leaders using residual returns, not raw returns.
- Require leadership to show up in residuals for two checks. If a sector stops “leading” after neutralizing factors, it was never a leader.
For the classic framing of why these allocation and factor tilts matter, see Determinants of Portfolio Performance.
Rate and commodity shocks
Tie moves to macro shocks, because one impulse can drag a whole sector up or down.
- Correlate sector returns with 2Y and 10Y yield changes.
- Correlate sector returns with oil moves and curve shifts.
- Correlate sector returns with USD index moves.
- Tag days with macro releases and outlier moves.
- Separate trend days from shock days in your signal. If one driver explains the “lead,” you’re trading macro through a sector wrapper.
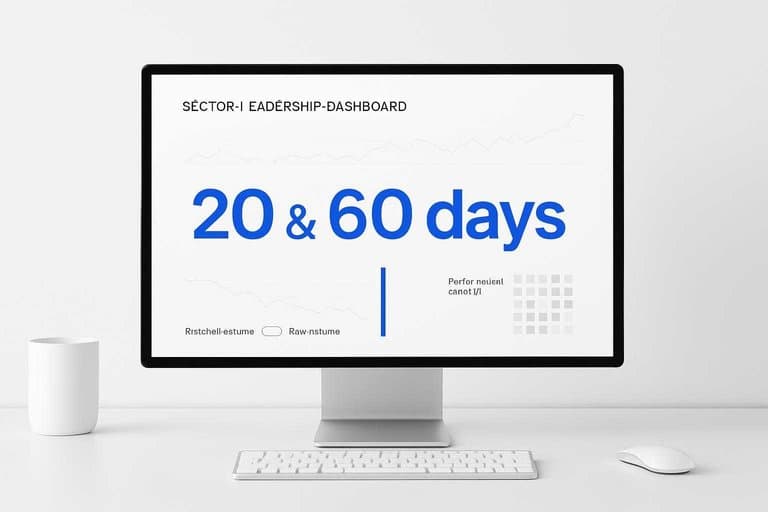
Regime filter rule
Use a persistence rule, because real leadership survives changing windows and internal participation. A simple version: act only if the sector leads in both a short window (e.g., 20 trading days) and a longer window (e.g., 60 days), or if the short-window lead is confirmed by breadth like % of constituents above their 50-day average. You’re not filtering returns; you’re filtering illusions.
Fix with Robust Signals
Fragile sector rankings create “leaders” that vanish after one bad day. Replace them with a few checks that survive noise and still tell you what to do.
Two-stage confirmation
You want fewer false leaders without adding a PhD filter. Use a two-stage gate: rank first, then demand confirmation from participation and quality.
- Rank sectors by your primary signal, like 3-month relative strength.
- Compute breadth for each sector, like % members above the 50-day.
- Compute risk-adjusted return, like 60-day Sharpe or volatility-scaled return.
- Trade only when rank and both confirmations agree on direction.
You’re not predicting more; you’re refusing to act on weak evidence.
Turnover limiter
High turnover is a symptom of a fragile signal. Add simple friction so your system stops chasing every rank twitch.
- Set a minimum holding period to ignore short-lived flips.
- Add a re-entry cooldown to avoid immediate buyback whipsaws.
- Require a rank-change threshold to act only on meaningful moves.
- Cap weekly trades to prevent signal “thrashing.”
If your edge is real, it survives waiting a few days.
Benchmark-relative scoring
Absolute returns lie when volatility shifts. Score sectors relative to a broad index, then normalize with rolling z-scores.
Example: compute sector / SPY relative strength, then z-score it over 252 trading days. Use the same window and transformation for every sector. Your “top 3” stays comparable in calm and chaotic regimes.
Consistency beats cleverness when markets change character.
Sanity-check dashboard
Before you trust the “leaders,” run a fast checklist. It catches the dumb stuff that ruins good models.
| Check | What you test | Quick threshold | Failure looks like |
|---|---|---|---|
| Data freshness | Latest close present | No missing day | Stale winners |
| Mapping | Constituents correct | No symbol drift | Wrong sector leaders |
| Breadth | Participation level | >50% advancing | Single-name carry |
| Concentration | Top weights impact | <30% top-2 | Hidden fragility |
| Regime | Trend vs chop | Trend filter true | Whipsaw zone |
If any row fails, treat the ranking as “diagnostic,” not tradable.
Lock in a Sector Leaderboard You Can Trust
- Reproduce the “false leader” on a fixed date/time and write down what you expect to see (top sectors, top names, and why).
- Validate the inputs end-to-end: adjusted prices and split history, correct point-in-time constituents, and accurate sector mappings with no stale/missing bars.
- Stress-test the ranking: vary the return window, compare equal- vs cap-weight, check for volatility/outlier domination, and eliminate any lookahead leakage.
- Ship a robust fix: benchmark-relative scoring with a two-stage confirmation, a turnover limiter, and a small dashboard (breadth, top-5 concentration, missing-data alerts) to catch regressions early.
Frequently Asked Questions
Why do my stocks by sector charts show different “leaders” on Yahoo Finance vs TradingView vs Bloomberg?
Most differences come from sector classification systems (GICS vs ICB vs proprietary), rebalance timing, and corporate-action adjustments. Make sure you’re comparing the same universe, classification date, and total-return vs price-return series.
Do I need sector ETFs to analyze stocks by sector, or can I build sectors from individual stocks?
You can do either, but sector ETFs usually give cleaner, continuously tradable proxies with built-in rebalancing. If you build sectors from stocks, use a rules-based membership list and cap or equal-weight to avoid a few mega-caps dominating the signal.
How do I measure sector breadth so “stocks by sector” leadership isn’t just one or two big names?
Use breadth metrics like percent of constituents above the 50/200-day moving average, advance/decline lines, or the share of stocks outperforming the sector’s median return. A sector is usually healthier when multiple breadth measures rise alongside relative strength.
How long should I wait before trusting a sector rotation signal from stocks by sector rankings?
Use a confirmation window of at least 4–8 weeks for swing signals and 3–6 months for strategic allocation changes. Shorter windows often capture mean reversion and headline-driven spikes rather than durable leadership.
Can I use equal-weight sector returns instead of market-cap-weighted to reduce false sector leaders?
Yes—equal-weight often reveals whether leadership is broad-based and reduces mega-cap distortion. Compare both side by side; when cap-weight leads but equal-weight lags, leadership is often concentrated and less reliable.
Find Real Sector Leaders
Once you’ve debugged false leaders in sector rankings, the hard part is keeping clean, regime-aware signals updated every day without extra analysis time.
Open Swing Trading surfaces potential breakout leaders with volatility-adjusted relative strength, breadth, and sector/theme context—built for discretionary chart traders. Get 7-day free access with no credit card.