Stocks by sector vs industry for breakouts
A clear comparison for finding breakout stocks by sector vs. by industry—learn the core definitions, breakout drivers (macro flows, themes, earnings clusters), signal quality and breadth cues, a practical comparison table, and scan workflows by time horizon.
If your breakout scans feel noisy, it may not be your indicators—it may be your grouping. A stock breaking out inside a strong sector can behave very differently than one leading a tight industry group, even if the chart pattern looks identical.
This comparison shows you when sector-level strength matters most, when industry leadership produces cleaner follow-through, and how to confirm moves with breadth, leaders, and catalysts. You’ll leave with a simple scan workflow and a time-horizon match so your next “breakout” is less guesswork and more structure.
Decision Snapshot
You can hunt breakouts at the sector level for cleaner, slower themes, or at the industry level for earlier, sharper moves. Think “Energy ripping” versus “Oil & Gas E&P breaking out.” This guide shows who each approach fits, what you’ll miss, and how to choose without guessing.
Core definitions
A sector is the big bucket, like Technology or Health Care, and an industry is a narrower slice inside it. Many platforms also use “group” to mean sub-industry or a custom basket, like “Semis” or “Regional Banks.”
A breakout is price clearing a prior range or level on expanding participation, not a single green candle. Granularity changes what you call a breakout, because industries can pop while the sector stays flat.
More granularity gives earlier signals and more false positives; less granularity gives fewer signals and more follow-through.
Key tradeoffs
Sector vs industry changes your whole workflow, not just your chart list.
- Move slower, confirm longer, miss first leg
- Trigger earlier, fake out more, demand tighter filters
- Offer broader breadth, hide leaders and laggards
- Diversify exposure, dilute the strongest theme
- Reduce workload, simplify entries and sizing
Pick the level that matches your tolerance for noise, not your appetite for excitement.
When each wins
Sectors tend to lead when macro forces dominate, like rates, oil, or broad risk-on rotations. In those tapes, correlations rise and “everything in the bucket” moves together.
Industries tend to lead when dispersion is high, like post-earnings seasons or tech inflections. Then correlation breaks down and the winners separate fast.
Watch correlation structure: high correlation rewards sector screens; low correlation rewards industry hunting.
Breakout Drivers
Sector breakouts usually start with big, blunt forces. Industry breakouts usually start with a sharper catalyst that concentrates attention and capital.
Your job is to spot what can pull in new buyers fast. Then decide if the move should spread across a sector, or stay trapped inside one industry.
Macro flow impacts
Rates, commodities, and policy changes reprice cash flows across many tickers at once. When that happens, money moves by ETF bucket first, and charts “break out” together.
Think “higher yields hit long-duration tech,” or “oil spikes lift energy,” or “defense spending boosts industrials.” If you see simultaneous relative strength across dozens of names, you’re watching macro flows, not stock picking.
Theme and narrative
A tight narrative can concentrate demand in one industry, even with a quiet sector.
- Regulation rewrites winners and losers
- Tech shifts reset cost curves
- Supply shocks change pricing power
- Consolidation creates scarcity premiums
- Product cycles pull forward demand
Trade the narrative like a clock: it works best before consensus fully prices it.
Earnings clustering
Industries often report in a tight window, so surprises can arrive in clusters. A few beats, raised guides, and “demand is stronger than expected” quotes can trigger fast re-rating across close peers.
That can happen even while the broader sector drifts, because the buyers are benchmarking against peer multiples, not the sector ETF. If the same surprise repeats three times, the breakout usually becomes an industry event. For more on how earnings information can transmit to peers, see this research on the aggregate earnings-returns relation.
Signal Quality
Sector scans usually give you cleaner breakout pictures because the constituents average each other out. Industry scans show turns sooner, but they also show every wobble and shakeout.
Trend readability
Sector charts tend to print smoother trends because dozens of names cancel out single-stock drama. Industry charts can flag the turn earlier, but the inflection often looks like a jagged “V” instead of a clean base.
A sector ETF can grind up with tidy higher lows while one sub-industry chops for weeks. That chop is often the early clue.
Use sectors to see the path, then industries to see the pivot.
False breakout risks
Granularity changes the traps you’ll hit and how fast they hurt. Know the failure modes before you trust the trigger.
- Sector head-fakes from a few mega-caps dominating the move
- Industry “one-stock wonders” pulling a group chart over the line
- ETF rebalancing spikes faking demand or supply
- Thin liquidity in niche groups widening spreads and slippage
If the breakout needs one name or one print to work, it’s already fragile.
Confirmation cues
Treat confirmation like a checklist, not a vibe. You want multiple independent “yes” signals.
- Check relative strength versus the market and the parent sector.
- Look for breadth thrust inside the group, not just the top two names.
- Demand volume expansion on the breakout bar or breakout week.
- Confirm multi-timeframe alignment: daily trigger, weekly structure, monthly trend.
When three timeframes agree and breadth joins in, whipsaws lose their edge.
Breadth and Leadership
Breakouts follow through more often when leadership is broad. You want many stocks pushing, not one “hero” name dragging an index.
Participation metrics
Breadth is your lie detector for “strong market” headlines. Measure participation at both the sector level and the industry level.
- Track % above 20/50/200-day moving averages
- Compare new 52-week highs versus lows
- Monitor advance/decline lines by group
- Contrast equal-weight versus cap-weight returns
If sectors look fine but industries don’t, the move is thinner than it appears.
Leader selection
You’re trying to buy strength with confirmation, not stories. A clean process keeps you out of random, low-quality “breakouts.”
- Rank sectors, then rank industries inside them by relative strength.
- Filter for liquidity and tight spreads in your timeframe.
- Pick the strongest names with clean bases and rising volume.
- Set an entry trigger above resistance and a clear invalidation level.
- Size the trade so the invalidation is a small, planned loss.
Your edge is repeatability, not genius.
Crowded leadership
Crowding shows up when the same few names carry everything. It feels great until it snaps, like “everyone owns the same trade”.
Narrow breadth, extreme dispersion, and parabolic leaders are the classic tells. When momentum fades while price grinds higher, sponsorship may be leaving.
When leadership gets crowded, you trade faster or you wait.
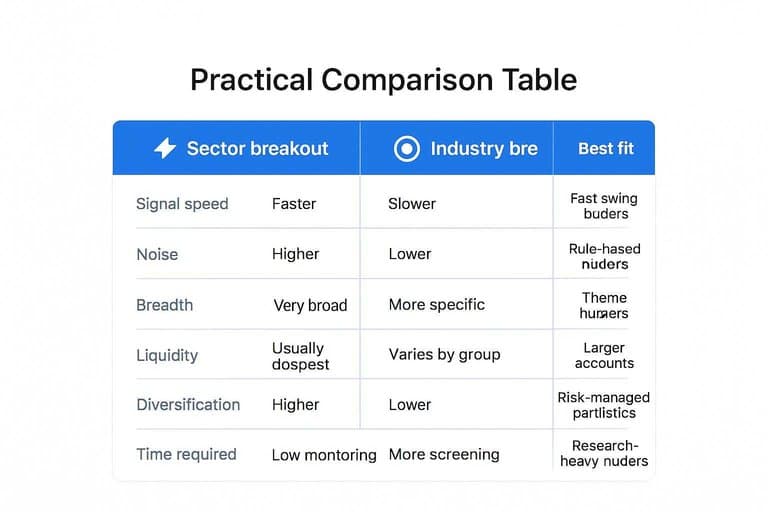
Practical Comparison Table
You can scan sector breakouts faster, but you’ll trade more “index-ish” moves. Industry breakouts take longer to form, yet they often pinpoint the real leader group.
| Factor | Sector breakout | Industry breakout | Best fit |
|---|---|---|---|
| Signal speed | Faster | Slower | Fast swing traders |
| Noise | Higher | Lower | Rule-based traders |
| Breadth | Very broad | More specific | Theme hunters |
| Liquidity | Usually deepest | Varies by group | Larger accounts |
| Diversification | Higher | Lower | Risk-managed portfolios |
| Time required | Low monitoring | More screening | Research-heavy traders |
Use sectors to catch the wave, then drill into industries to find the surfers. If you want a clear definition of what counts as a sector vs. an industry, refer to the GICS® classification standard.
Scan Workflow Options
You need a scan workflow you can run every week without thinking. Pick a default, then break the rules only with a clear reason. For example: “I only trade breakouts when the tide and the wave match.”
Sector-first flow
Start top-down when you want fewer, higher-conviction candidates. It keeps you trading with the broad tape, not against it.
- Rank sectors by relative strength and trend slope.
- Confirm breadth with advancing names and new highs.
- Drill into the strongest industries inside those sectors.
- Select leading stocks with clean bases and liquidity.
- Define entry trigger, stop, and invalidation level.
When sector breadth is strong, your breakout has tailwind instead of luck.
Industry-first flow
Start bottom-up when rotations are fast and leadership is narrow. It helps you catch the theme before it shows up in sector averages.
- Scan for industries with sharp RS acceleration and volume expansion.
- Validate sector context is neutral-to-supportive, not collapsing.
- Check leader concentration and whether breakouts cluster together.
- Choose liquid names with tight ranges and obvious levels.
- Set trigger above range, stop below structure, and time stop.
If you see three leaders breaking out together, you’re looking at real demand.
Hybrid stacking
Use stacking when you want a simple position-sizing rule, not a debate. You trade biggest when multiple layers agree, and you trade smaller when they don’t.
Trade full size when sector + industry + stock all confirm strength. Trade half size when only sector+industry confirm, and keep stops tighter. Skip or paper-trade when only the stock looks good.
Your edge often comes from alignment, not from picking the “best” chart.
Time Horizon Fit
Breakout scans work best when your grouping matches your holding period. A day trader chasing a “chipmaker gap” needs different context than a position trader riding “energy tailwinds.” Pick sector vs industry based on how long you plan to sit in the move.
Short-term traders
Industries shine when the tape is reacting to one specific catalyst and you need fast confirmation. You’re trading the burst, not the thesis.
- Trade news bursts hitting one niche group
- Play earnings gaps with same-industry sympathy
- Target high-beta themes for quick expansion
- Use tight risk control with clear invalidation
If the catalyst is narrow, the industry basket is your lie detector.
Multi-week swings
Sectors tend to trend longer because capital reallocates slowly and index flows reinforce direction. Think “financials bid for weeks” while individual bank industries take turns leading and lagging.
Industry rotation can also mean-revert faster when leadership is too concentrated, spreads widen, or a single sub-industry gets crowded. That’s when the breakout works for days, then fades as money hops to the next pocket.
If you want a cleaner multi-week ride, follow the broad sector bid and let industries handle timing.
Position trades
Months-long holds need a backdrop that stays true through noise and pullbacks. Sectors give that “wind at your back,” but only when participation is real.
- See clear sector tailwinds from macro or policy
- Demand multi-industry participation, not one pocket
- Track improving fundamentals over multiple quarters
- Prefer stable volatility that doesn’t force exits
If the sector is strong and breadth is real, your breakout becomes an investment.
Pick a Lens, Then Stack Confirmation
- Start with your horizon: use sectors for macro-driven, multi-week moves; use industries for tighter, catalyst-driven breakouts and clearer relative strength.
- Validate the backdrop: check participation (advance/decline, % above key MAs) and identify 1–3 leaders making new highs before buying second-tier names.
- Reduce false breaks: demand confirmation—volume expansion, clean retest/hold, and relative strength vs. the sector/industry benchmark.
- Run a hybrid scan: sector-first to find where money is flowing, then drill into the strongest industries to select the best leader setup.
Frequently Asked Questions
Are stocks by sector the same as industry groups when you’re scanning for breakouts?
No. Sectors are broad buckets (e.g., Technology), while industries are narrower sub-groups (e.g., Semiconductors) and often move more sharply because the same catalyst hits a tighter set of names.
Should I scan stocks by sector with ETFs (like XLK/XLE) or with sector heatmaps and screeners?
Use sector ETFs to validate real money flow and clean price levels, then use a heatmap/screener (Finviz, TradingView, Koyfin) to identify the strongest stocks inside the sector for entries.
What indicators work best for confirming sector breakouts on stocks by sector lists?
Most traders confirm with relative strength vs. SPY (or the index you trade), a volume expansion signal (e.g., 20-day average volume break), and a simple trend filter like price above the 50-day and 200-day moving averages.
How many stocks in a sector should be breaking out before I trust the move?
A common rule is at least 30% to 50% of the sector’s major constituents making new 20–52 week highs or clearing key resistance within 1–2 weeks, not just one or two mega-caps pulling the ETF up.
Can I trade sector breakouts using options instead of buying the stocks by sector leaders?
Yes. Many traders use liquid sector ETFs for options (e.g., XLF, XLK, XLE) to express the thesis with defined risk, then switch to top industry leaders if they want higher beta and bigger potential moves.
Turn Sector Strength Into Lists
Knowing when to prioritize sector, industry, or single-name signals is only useful if you can spot leadership quickly and stay aligned with market breadth.
Open Swing Trading surfaces breakout leaders with daily RS rankings, breadth snapshots, and sector/industry views—built for discretionary chart setups. Get 7-day free access with no credit card.