How to Build a Powerful Swing Trading Stock Screener for 2026
Learn to build a swing trading stock screener that finds winning stocks. This guide provides actionable filters and strategies to gain a systematic edge.
A good swing trading stock screener is more than just a filter. It's a purpose-built tool designed to cut through the market noise, systematically whittling down thousands of stocks into a focused, manageable list of high-probability candidates. It goes way beyond generic scanning by applying criteria that match your specific strategy for catching short- to medium-term price moves.
Why a Custom Screener Is Your Greatest Trading Edge
In the fast-paced markets of 2026, chasing random "hot" stock tips or reacting to every market ripple is a surefire way to bleed your account dry. A much better path is building a systematic, repeatable process, and that process starts with a screener built for one job: finding setups that work for you. By leveraging this flexibility, you gain the freedom to adapt your strategy as market conditions change, a core benefit of open swing trading.
This isn't just about finding stocks that are moving. It's about finding the right stocks moving for the right reasons.
When you design your own screener, you’re embedding discipline directly into your workflow. It forces you to stick to your rules and removes emotion from that crucial first step. You automatically filter out institutional traps, illiquid penny stocks, and fundamentally weak companies that simply can't sustain a powerful move. This approach is all about aligning your stock selection with favorable market conditions—a core principle we live by at OpenSwingTrading.
The Advantage of Purposeful Filtering
Generic, out-of-the-box screeners often just flag stocks with unusual volume or sharp price spikes, but they give you zero context. This can easily lead you straight into volatile, unpredictable trades. A custom screener, on the other hand, is built with intent.
Here’s what it really does for you:
- Saves You Time: It automates the mind-numbing task of flipping through hundreds of charts. Your analytical energy is reserved for only the most promising candidates.
- Forces Discipline: Sticking to your criteria is the ultimate antidote to impulsive decisions driven by hype or fear of missing out (FOMO).
- Spots Institutional Footprints: Specific filters for volume and relative strength help you see where the big money is flowing. That’s the fuel for sustained uptrends.
The idea of capturing these multi-day moves has been around for decades. Swing trading’s roots can be traced back to 1950 with George Douglas Taylor's 'The Taylor Trading Technique.' His 'three-day cycle' theory identified predictable buy and sell days, laying the groundwork for many modern strategies. You can find more details about this historical approach over on atas.net.
A great screener doesn't give you buy signals. It gives you a high-quality list of ideas that deserve your attention. The real edge comes from knowing your screener is built to find setups that match your specific trading plan.
Ultimately, building your own swing trading stock screener is about creating a systematic edge. You stop chasing fleeting hype and start capitalizing on genuine, verifiable momentum. This gives you a repeatable workflow for finding A-grade opportunities, week in and week out.
Building Your Screener: The Core Filters That Matter
Alright, let's move from theory to action. The real power of a stock screener comes from the filters you choose. These are your non-negotiable rules of the road, the bouncers at the door that automatically weed out 99% of the market noise, leaving you with only the most promising candidates for a swing trade.
Think of it like building a custom fishing lure. Each filter is designed to attract a very specific type of fish—in our case, stocks with the potential for explosive upward moves. The goal here is to give you a solid, proven foundation you can plug right into a tool like Finviz or TradingView.
First Things First: Ensuring Liquidity and Dodging Disaster
Before we look for any fancy patterns, we have to make sure we're even looking at tradable stocks. Swing trading requires getting in and out of positions smoothly, and that's just not possible with thinly-traded, illiquid names. Getting stuck in a low-volume stock is a classic rookie mistake that leads to terrible fills and painful slippage.
To sidestep these traps from the get-go, we set two hard-and-fast rules:
- Minimum Share Price > $15: This one filter instantly clears out the vast majority of junk penny stocks and low-quality companies. These names are often subject to manipulation and the kind of wild, unpredictable volatility you want to avoid.
- Average Daily Volume (3-Month) > 500,000 shares: This ensures there’s a crowd. With at least half a million shares changing hands daily, you know there’s enough institutional and retail interest to enter and exit a decent-sized position without single-handedly moving the price.
These two simple criteria are your first line of defense. They guarantee you’re only dealing with legitimate, institutionally-recognized companies.
Focus on Strength: Hunting for Stocks in Confirmed Uptrends
Swing trading is a game of momentum. We're not trying to be heroes by catching falling knives; we're looking to ride a wave that's already moving. Your screener’s primary job is to find stocks that are already showing clear signs of bullish strength.
The easiest way to do this is with simple moving averages (SMAs). A great starting point is to screen for stocks where:
- The price is trading above the 50-day SMA.
- The price is also trading above the 200-day SMA.
This simple two-part check confirms that both the medium-term and long-term trends are pointing up. It keeps you focused on stocks in a healthy Stage 2 uptrend, which is where the highest-probability swing trades are found. You’re fishing in the right pond, and that alone dramatically stacks the odds in your favor.
A robust swing trading stock screener doesn't just find what's moving today; it finds what's already in a position of strength and likely to continue moving tomorrow. It's about probability, not prediction.
Consider the broader market context to understand why this matters. Over the last five years, the S&P 500 has posted an impressive 16.43% annualized return (11.327% ex-dividends), thanks in large part to powerful trends in tech and the post-pandemic recovery. By building a screener that hunts for stocks outperforming this already strong benchmark, you're tapping directly into market-leading momentum. You can dig into more historical S&P 500 return data on TradeThatSwing.
Isolate the Leaders with Relative Strength
Now it's time to separate the good from the great. Relative Strength (RS) is the ultimate tool for this job. It’s a simple metric that measures how a stock is performing compared to the rest of the market (usually the S&P 500). A high RS rating tells you a stock is blowing its peers out of the water.
In your screener, set the Relative Strength Rating to > 80. This is a powerful constraint. It means you will only see stocks that are outperforming 80% of the entire market. These are the true leaders, the names attracting big money from hedge funds and other institutions. Focusing on this elite group concentrates your capital where it has the highest potential to capture those powerful, outsized moves we’re all looking for.
To make this crystal clear, here’s a table summarizing the essential filters you can use as a starting template in your preferred screening software.
Essential Swing Trading Screener Filter Settings
| Filter Category | Specific Filter | Recommended Value | Rationale |
|---|---|---|---|
| Liquidity & Quality | Share Price | > $15 | Filters out penny stocks and low-quality, high-risk companies. |
| Liquidity & Quality | Average Volume (90-Day) | > 500,000 shares | Ensures enough liquidity for easy entry and exit without significant slippage. |
| Trend Confirmation | Price vs. 50-Day SMA | Price > 50-Day SMA | Confirms the stock is in a healthy medium-term uptrend. |
| Trend Confirmation | Price vs. 200-Day SMA | Price > 200-Day SMA | Confirms the stock is in a solid long-term uptrend. |
| Leadership | Relative Strength Rating | > 80 | Isolates market leaders that are outperforming at least 80% of all other stocks. |
This combination of filters provides a powerful starting point. It’s designed to be strict, ensuring that only the highest-quality setups make it onto your radar, saving you time and focusing your analysis on what truly matters.
Turning Screener Results into an Actionable Watchlist
Okay, so you've run your screener. Now you’re staring at a list of 30, 50, or maybe even 100 stocks that fit your criteria. This isn't the finish line; it's the starting gun. A raw list is just noise. Your real job is to find the five to ten A-grade setups hidden in that list.
This is where the real work—the human touch—begins. We need to move beyond the raw data and visually qualify each stock. The goal is simple: make sure the chart actually looks as good as the numbers suggest it should.
From Raw Data to a Refined Shortlist
First things first, you need to be ruthless. Your initial pass is all about speed and visual inspection. Pull up the daily chart for every single stock on your list and make a quick judgment call.
I’m looking for clean, obvious price action. If a chart is choppy, erratic, or looks like a complete mess, I discard it immediately. Same goes for a stock that’s trading way off its recent highs, even if it technically meets my moving average filters.
Here’s what I’m hunting for on the daily chart:
- Constructive Consolidation: Is the stock building a solid base? Think clean patterns like a flat base, a classic cup with handle, or a high, tight flag. These are signs of a healthy pause before a potential breakout.
- Orderly Pullbacks: If the stock is pulling back, is it doing so on lighter volume? Is it finding support at a key level like the 20-day or 50-day moving average? That often signals a low-risk entry is forming.
- A Clear Uptrend: Does the chart show an obvious series of higher highs and higher lows? Avoid anything that looks directionless or unpredictable.
This whole process is built on a simple philosophy: filter for liquidity first, then trend, and finally, strength.
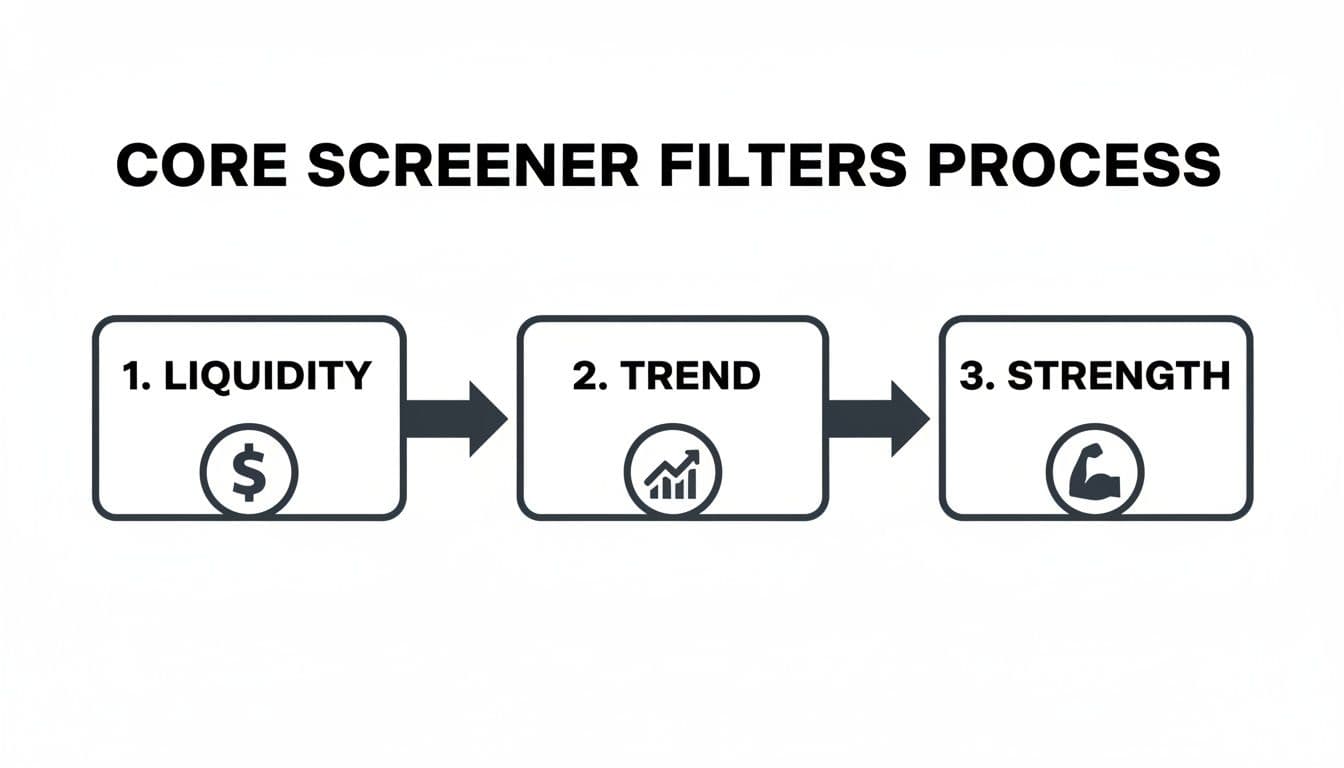
This three-tiered approach ensures any stock that even makes it to your chart review has already passed the most important tests.
Adding Sector and Contextual Analysis
Once you have a shortlist of visually appealing charts, it's time to add context. This is a core part of the OpenSwingTrading approach: first assess the overall market, find the hot sectors, then pinpoint the strongest stocks within them. A great stock in a terrible sector is swimming upstream—it’s a fight you don’t need to pick.
Next, you have to play defense. Check for any upcoming catalysts that could blow up a perfectly good trade. The biggest culprit? An earnings report. Entering a swing trade a few days before an earnings announcement isn't trading; it's gambling. A bad report can cause a massive gap down that blows right past your stop-loss.
A great watchlist isn't just a collection of strong charts. It's a curated list of the strongest stocks in the strongest sectors, with clean patterns and no immediate event risk.
This disciplined approach is what separates amateurs from pros. Traders who combine a well-defined screener with this kind of rigorous analysis often see win rates between 35% and 50%. While that might not sound astronomical, the compounding returns from those winning trades can consistently outperform passive index investing. For a deeper dive, check out the data on swing trading success rates on TraderLion.
By the time you’re done, that initial firehose of 50+ stocks should be whittled down to a highly focused watchlist of just 5-10 prime candidates. These are the names that truly deserve your attention for a potential entry in the days ahead.
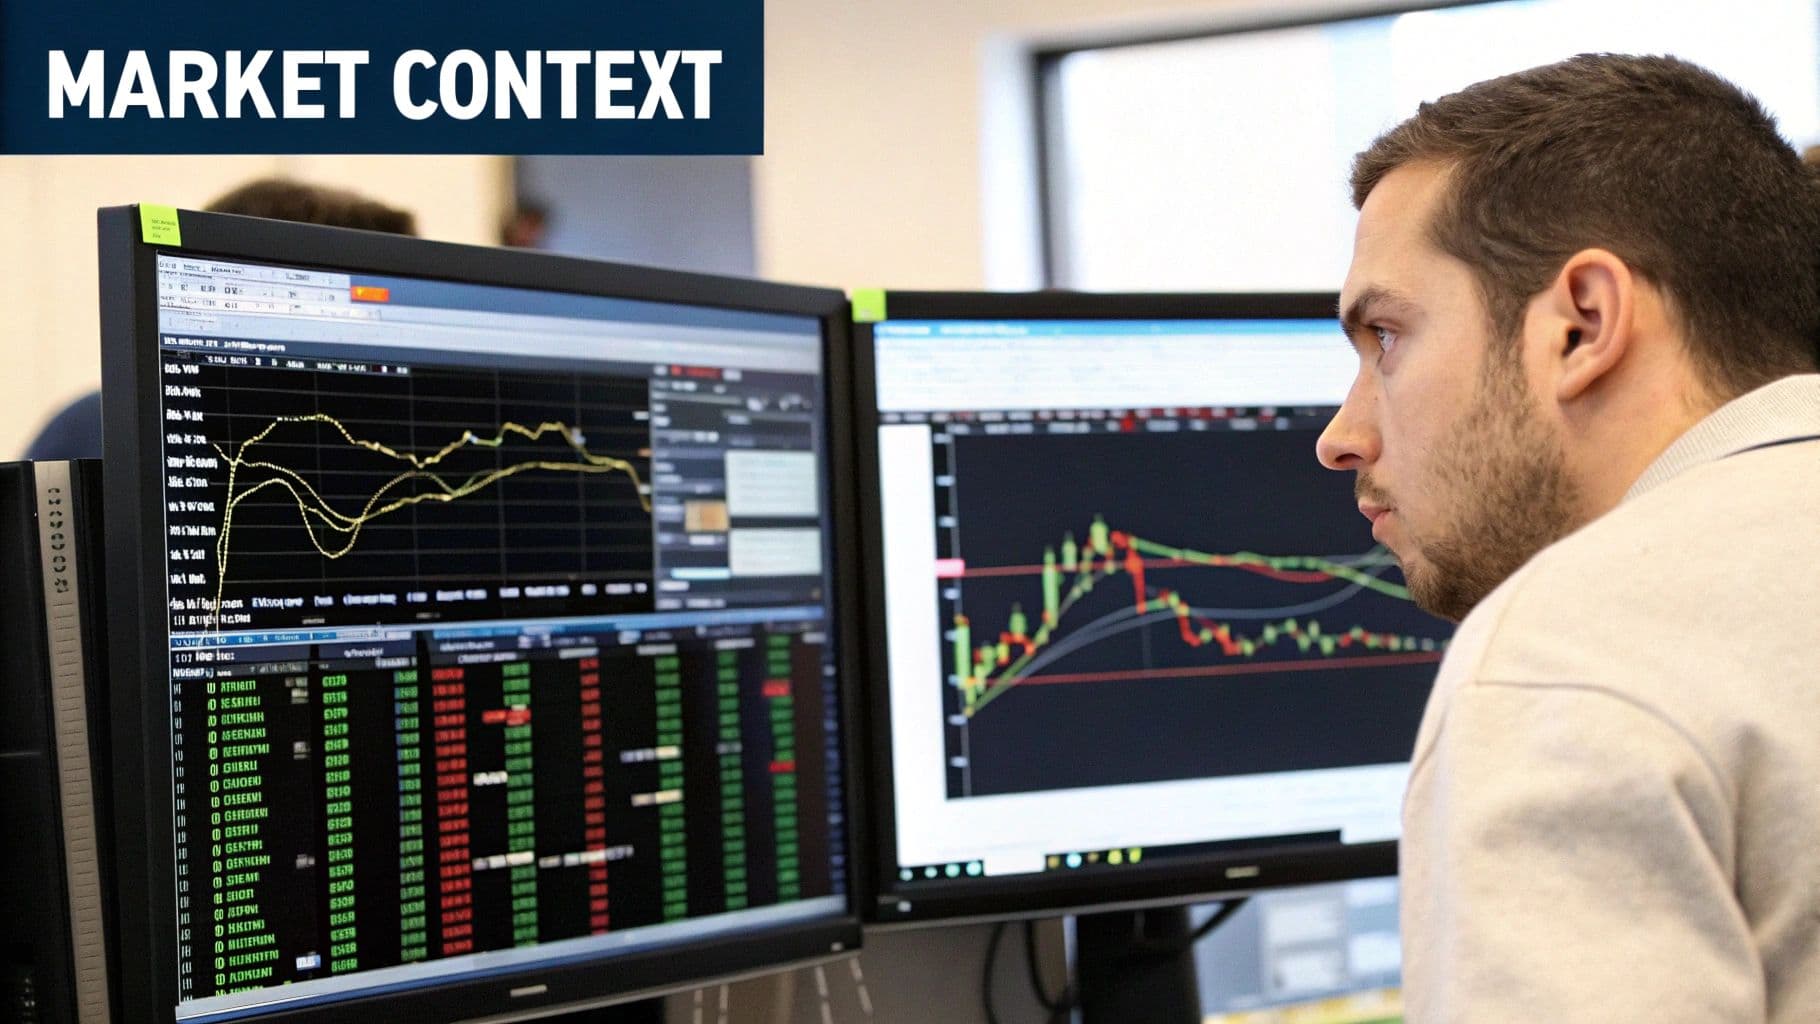
Putting Your Screener Results into Context
Alright, so you’ve built a killer screener and it’s spitting out a list of technically strong stocks. That's a huge step forward, but it's only half the battle. A list of great-looking stocks is useless—or even dangerous—if you don't look up and see what the overall market is doing.
This is where many traders get tripped up. Before you dive into a single chart from your screener, you have to ask one simple, critical question: Is now even a good time to be buying stocks?
This idea of contextual awareness is central to how we approach things at OpenSwingTrading. Think about it: even the most perfect A+ setup in a market-leading stock can get completely steamrolled if the entire market is weak or starting to roll over. Ignoring the market's health is like trying to sail a speedboat straight into a hurricane. Your powerful boat doesn't stand a chance against that kind of overwhelming force.
How Healthy is the Market, Really?
To get a real feel for the market's health, we need to look beyond the major indexes like the S&P 500. A rising index can easily fool you if it's just a handful of mega-cap giants doing all the heavy lifting. We need to look under the hood using market breadth indicators. These are like an x-ray, showing us the market's internal strength.
Here are a couple of my go-to indicators:
- The S&P 500 Advance-Decline (A/D) Line: This is a simple but powerful tool. It tracks the net number of stocks advancing versus declining each day. When the A/D line is rising along with the S&P 500, it confirms that the rally has broad support. It's healthy.
- Percentage of Stocks Above Key Moving Averages: I always watch how many stocks are trading above their 50-day and 200-day SMAs. When these percentages are high and climbing, it tells you there's a strong tailwind for long swing trades.
If these indicators are flashing green, then it’s full steam ahead with your watchlist. But if you see them getting weaker while the index is still holding up? That's a massive red flag telling you to get defensive, fast.
Your screener finds the best athletes, but market breadth tells you if it's the right season to put them in the game. Ignoring this step is one of the costliest mistakes a swing trader can make.
Bringing It All Back to Your Charts
Once you've confirmed the market is on your side, it’s time to bring that curated watchlist into your charting software. I use TradingView, but the process is similar for most platforms. Now, the real work begins: setting alerts.
As you go through your charts, you'll spot potential entry points—maybe a stock is consolidating in a tight range or pulling back to a key level. Don't just stare at it. Set an alert just above that consolidation or at your target entry price.
This simple act automates your entire monitoring process. Instead of being glued to your screen, you let the market do the work and tell you when a stock is ready to move. This creates a disciplined, repeatable workflow: check the market, analyze the stock, set the alert, and wait. It’s a powerful routine that keeps you focused on only the highest-probability setups.
How to Refine and Backtest Your Screening Strategy
A powerful swing trading stock screener isn't something you build once and then forget about. The market is a living, breathing thing, and its personality is always shifting. To stay effective, your screener has to evolve right along with it—and with your own skills as a trader.
This is where the real work begins. Refining your process through backtesting turns a good set of rules into a robust, adaptable system. It’s how you build real confidence in your strategy, so you can pull the trigger based on data, not hope.
Validating Your Filters Against Past Markets
Backtesting doesn't have to mean writing complex code. Sometimes, a simple historical review is all you need to find massive insights.
Just go back to a previous market uptrend—maybe the big rally we saw last year—and run your current screener using that historical data.
Ask yourself some hard questions:
- Did your relative strength filter actually pinpoint the biggest market leaders during that run?
- Were your volume and moving average settings sharp enough to catch those early breakouts?
- More importantly, did your criteria keep you out of the garbage during the last market correction?
This simple review creates a feedback loop. If your screener missed all the best-performing stocks during a raging bull market, that’s a huge red flag. It probably means your parameters are too tight or just aren't calibrated for what's working right now.
The Power of a Trading Journal
Your trading journal is your secret weapon for screener optimization. Every single trade you take, win or lose, is a valuable piece of data. When you review your trades each week, don't just glance at the P&L.
Connect each trade's outcome directly to your screening process. Was the setup clean when you found it? Was the stock a true leader in a hot sector? Or did you get impatient and override one of your own rules?
A screener finds potential candidates; your journal reveals the truth about your execution. By linking every trade back to your initial scan, you can spot patterns in what's working and what isn't, allowing for precise, intelligent adjustments.
For instance, you might notice that your biggest winners consistently came from stocks with a relative strength rating above 90, not just the 80 you started with. That’s a game-changing insight. You can immediately tighten that filter and instantly improve the quality of your future watchlists.
This constant cycle of screening, executing, journaling, and refining is what drives long-term trading success. It ensures your swing trading stock screener remains a sharp, effective tool that's perfectly matched to whatever the market throws at you. This is how you truly take advantage of the flexibility that open swing trading offers—by adapting as the market changes.
Common Questions About Swing Trading Screeners
Even with a solid plan, building a new system always brings up questions. Let's tackle some of the most common ones that pop up when traders first start creating and using a swing trading stock screener. Getting these details right can make a world of difference in your workflow and, ultimately, your results.
How Often Should I Run My Screener?
For most of us swing trading in 2026, the sweet spot is running your screener once a day, right after the market closes. This simple 15-minute habit is a game-changer. It gets you out of the intraday chaos and emotional roller coaster, letting you make clear-headed decisions based on the day's final numbers.
This end-of-day routine gives you the space to calmly review what happened, build a tight, focused watchlist, and map out your plan for the next morning. It helps you stay proactive and disciplined—a core principle of open swing trading—instead of getting whipsawed by every news alert and price tick.
Can I Start with a Free Tool?
Absolutely. You can definitely get your feet wet with a free tool like Finviz. The basic filters we've talked about—price, volume, and moving averages—are available on most free platforms. They're more than enough to build a solid foundation for finding good-looking setups, and it's a fantastic way to learn the ropes without spending a dime.
But as you get more serious, you'll likely find that paid services are worth the investment. They often have proprietary metrics you won't find elsewhere, like volatility-adjusted relative strength or built-in market breadth tools. These advanced features can seriously simplify your process, saving you a ton of time and giving you a much sharper analytical edge.
What Is the Biggest Screener Mistake?
The single biggest mistake I see traders make is treating their screener like a magic box that spits out buy signals. It's not. They just blindly trade whatever stocks pop up on the list without doing any real work.
A screener is your starting point, not your final decision-maker. Its job is to filter thousands of stocks down to a manageable list of statistically strong candidates. The real trading craft—chart analysis, risk management, and checking the market's pulse—is still up to you.
Think about it: a stock can tick every single one of your technical boxes but have a major earnings report coming out tomorrow. Or maybe it's in a sector that's just starting to roll over and weaken. The best traders know this. They use the screener as the first critical filter, then they pull up the charts, look for clean patterns, check for any upcoming news, and make sure the broader market and sector trends are on their side.
Ready to stop chasing random stocks and start trading with a data-driven edge? OpenSwingTrading provides the market context and relative strength analytics you need to build high-quality watchlists in just 15 minutes a day. See how our platform can refine your stock selection process by visiting https://openswingtrading.com to start your free trial.