Swing Trading Strategies for Beginners To Master the Market in 2026
Discover powerful swing trading strategies for beginners. This guide breaks down actionable setups, risk management, and a daily workflow to help you succeed.
If you're looking for a way to trade the markets that doesn't chain you to your screen, swing trading might be the perfect fit. The whole point is to catch price moves that play out over several days or weeks. This sweet spot lets you sidestep the constant stress of day trading while still aiming for solid profits, making it a fantastic strategy for anyone with a busy life in 2026.
Why Swing Trading Is a Smart Choice for Modern Traders
Let's get one thing straight: swing trading isn't about being glued to your charts all day. It’s a deliberate method for riding the market's natural rhythm—the swings up and down. You're looking to capture a single, powerful move that might take days or even a couple of weeks to unfold. This longer timeframe is a huge advantage, especially if you're juggling a career or other responsibilities.
Instead of the hyper-caffeinated, split-second decisions that day trading demands, swing trading operates at a much more manageable pace. The game plan is simple: spot an emerging trend, jump in, and ride it until the momentum starts to fade. This methodical process dials down the emotional rollercoaster that so often derails new traders.
A Clearer View of the Market
Lots of people confuse swing trading with day trading, but they're fundamentally different approaches. Here’s a quick breakdown to clear things up.
Swing Trading vs Day Trading Key Differences
| Aspect | Swing Trading | Day Trading |
|---|---|---|
| Timeframe | Trades last several days to a few weeks. | Trades are opened and closed within the same day. |
| Time Commitment | Often under 30 minutes per day for analysis. | Requires several hours of active screen time daily. |
| Goal | Capture larger, multi-day price "swings." | Profit from small, intraday price fluctuations. |
| Analysis | Focuses on daily and weekly charts. | Focuses on intraday charts (1-min, 5-min, 15-min). |
| Stress Level | Generally lower, as intraday noise is ignored. | Can be very high due to constant market monitoring. |
As you can see, swing trading is built for people who want to participate in the markets without making it their entire life.
Trading Smarter, Not Harder
In 2026, successful swing trading is all about making objective decisions based on solid data. It’s less about reacting to every news headline and more about systematically finding high-probability setups. This is where having a disciplined process makes all the difference.
Tools like OpenSwingTrading are built specifically for this. They provide actionable insights by helping you scan the market for stocks showing real strength and ideal conditions, so you can cut through the noise and focus on the handful of opportunities that actually matter.
This practical approach offers some killer benefits:
- More Free Time: A focused swing trader can do their analysis and manage trades in under 30 minutes a day, usually after the market has closed. This freedom allows you to build wealth without sacrificing your lifestyle.
- Less Stress: By ignoring the chaotic intraday price action and focusing on the bigger trend, you can trade with a much clearer head and make more rational decisions.
- Bigger Potential Gains: Holding a position for days allows you to capture a much larger chunk of a move than the tiny profits day traders chase.
Swing trading is the art of patience. It teaches you to wait for the market to come to you, rather than chasing every minor movement. This discipline is the foundation of long-term success.
Ultimately, swing trading gives you a structured, repeatable routine. You learn to read the market's health, follow the big money, and pinpoint the best stocks ready to move. It’s about being calculated and consistent, which is how you build a real edge.
Finding Momentum with the Relative Strength Breakout

One of the most effective ways for new swing traders to get started is by finding the market leaders before they make their next big move. This is the whole idea behind the relative strength breakout strategy—it’s all about spotting stocks that are already outperforming the broader market. It's a classic momentum play that puts you on the same side as the big institutional money.
The logic here is pretty simple: stocks that are already showing superior strength tend to keep outperforming. By focusing your energy on these leaders, you significantly stack the odds in your favor for catching a powerful uptrend. Forget about searching for a needle in a haystack; this approach points you directly to the stocks with real potential.
The Setup: Identifying High-Potential Candidates
The first job is to sift through thousands of stocks to find a small, manageable watchlist. You're looking for stocks that have been consolidating—trading sideways in a tight range—after a solid run-up. Think of this consolidation as a coiled spring, building up energy for its next explosive move higher.
This is where a good data-driven tool is worth its weight in gold. Using the scanners inside OpenSwingTrading, you can quickly filter for stocks with high relative strength rankings. This immediately narrows your focus to the market's true leaders, saving you countless hours you'd otherwise spend flipping through charts. The platform provides the actionable insights needed to see which stocks are holding up best, even when the overall market is a mess.
Once you've got a list of strong candidates, you’ll want to pull up the daily charts and look for a few key visual signs:
- A Prior Uptrend: The stock must have a clear history of rising prices before it started going sideways.
- A Well-Defined Base: Look for a clear price shelf where the stock has been trading for several weeks. This "base" is your launchpad.
- Decreasing Volume: During this consolidation, trading volume should ideally dry up. This is a great sign that sellers are losing steam and the available supply of shares is being absorbed.
Defining Your Entry and Exit Points
With a promising candidate on your screen, the next step is to map out your exact entry and exit points before you even think about putting on a trade. This rule-based approach is crucial for taking emotion and guesswork out of the equation.
Your entry point is going to be just a hair above the high of that consolidation base. That's your breakout level. When the price punches through that level on a noticeable surge in volume, it's a strong signal that buyers are back in charge and ready to push the stock higher. I often set a buy-stop order just above this resistance level to automate my entry.
Now for the most important part: managing your risk. Your initial stop-loss order is your safety net in case the breakout fizzles out. A simple and effective way I like to set my stop is by using the Average True Range (ATR). A good starting point is to place your stop 1.5 to 2.0 times the ATR below your entry price. This gives the trade enough room to wiggle without exposing you to a massive loss.
The goal of a breakout trade is to catch the beginning of a new leg up. By defining your entry, stop-loss, and profit targets in advance, you create a structured plan that prevents emotional decisions and keeps your risk under control.
Finally, you need a plan for taking profits. A solid rule of thumb is to aim for a reward that is at least twice your initial risk. For instance, if your stop-loss is set 2** below your entry, your first profit target should be at least **4 above it. This discipline is what ensures a positive risk-to-reward ratio over the long run.
Real-World Breakout Example
Let’s walk through a practical scenario. Imagine you've spotted a tech stock, XYZ, using OpenSwingTrading's relative strength scan. After a strong run, XYZ has been trading sideways between 95** and **100 for five weeks, and you've noticed volume has been drying up.
- Your Plan: You decide to get in if XYZ can break above the $100 resistance.
- The Entry: You place a buy-stop order at 100.10**. A quick check shows the stock's ATR is currently **1.50.
- The Stop-Loss: To protect your capital, you set your stop-loss at 97.10**, which is calculated as **100.10 - (2 * 1.50)**. Your total risk on the trade is **3.00 per share.
- The Profit Target: You set your initial profit target at 106.10** (**100.10 + (2 * $3.00)), locking in a solid 2:1 risk-to-reward ratio.
The next day, XYZ gaps up and pushes through $100 on heavy volume, triggering your entry order. Over the following two weeks, the stock rallies right up to your profit target, and you exit the trade for a clean win. This is a perfect example of how a systematic approach to one of the most reliable swing trading strategies for beginners in 2026 can work.
Buying the Dip with Moving Average Pullbacks
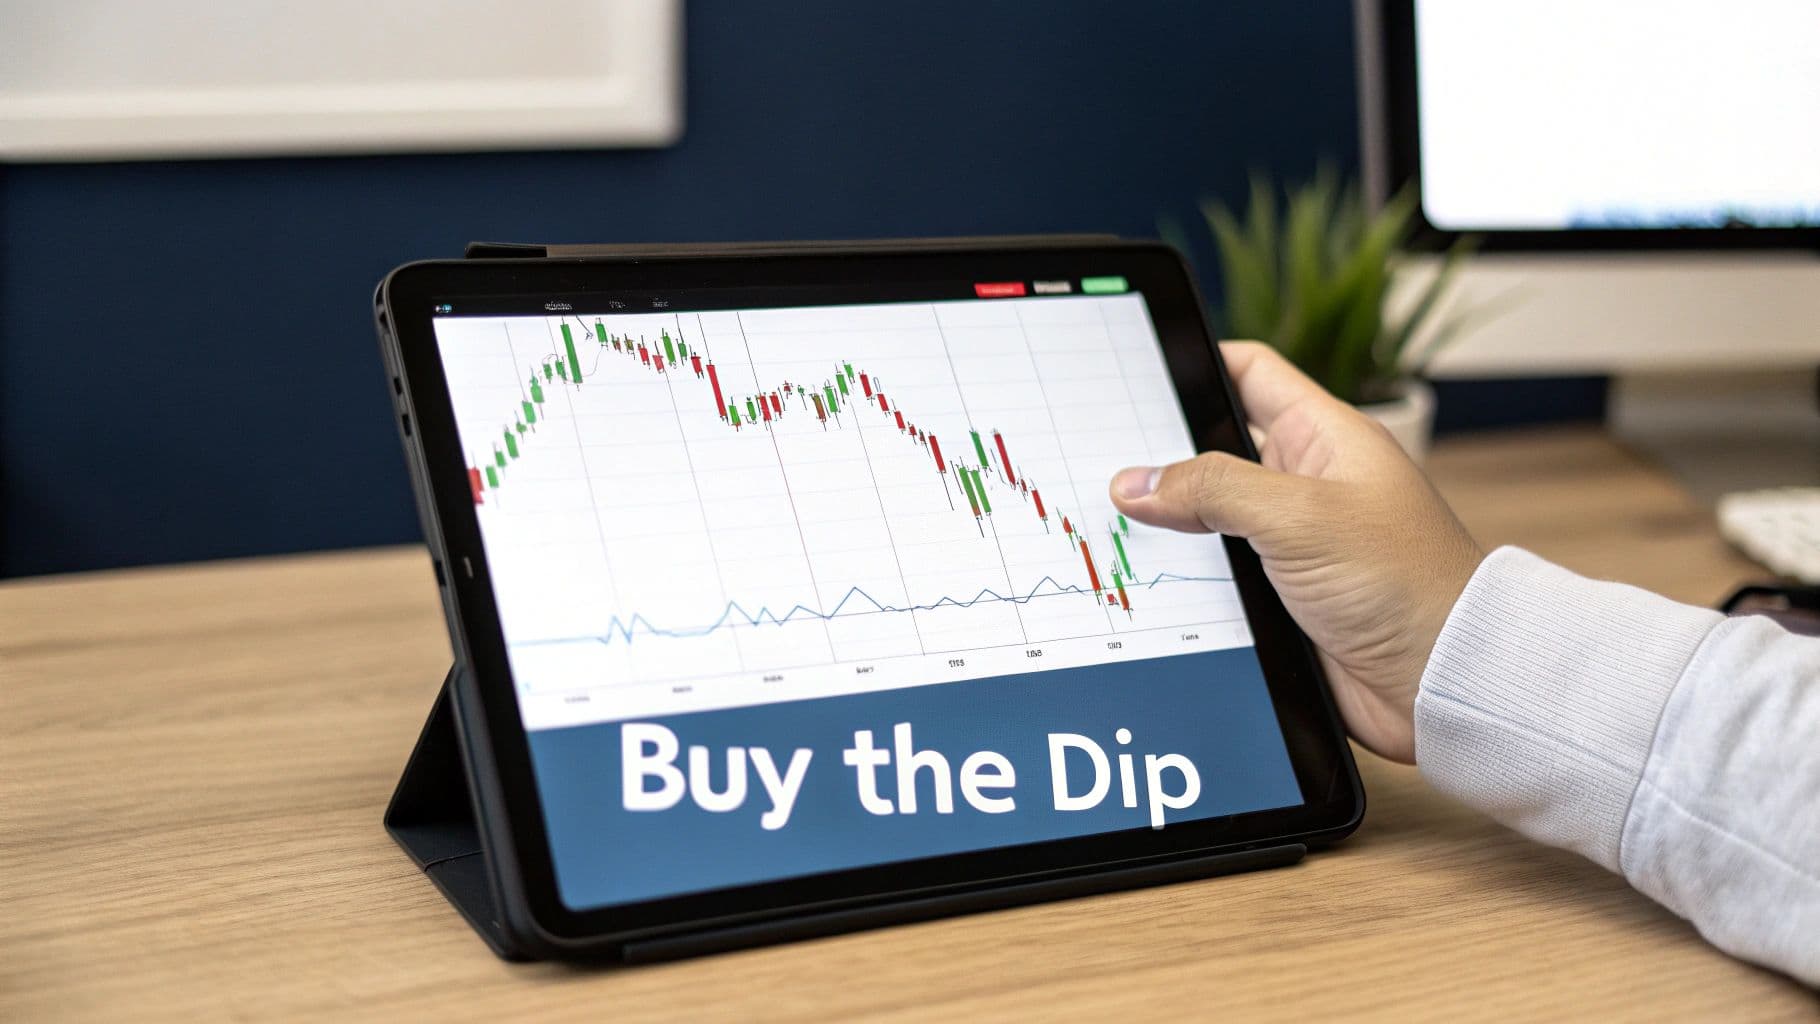
It’s tempting to jump on a stock that’s rocketing higher, but chasing a parabolic move is one of the fastest ways for a new trader to get humbled by the market. A much smarter, lower-stress approach is to let strong stocks come to you. This is the whole idea behind the moving average pullback—a classic strategy that’s been a workhorse for swing traders for decades, and it’s just as effective in 2026.
Think about it: even the healthiest uptrends need to breathe. They don't just shoot up in a straight line; they move in waves, pulling back to find new buyers before pushing higher. This strategy is all about using those temporary dips as your entry point, letting you buy into a powerful trend at a discount.
Finding Your Dynamic Support Zone
Moving averages are fantastic because they act like a flowing, visual guide for support and resistance. For our purposes, we're going to zero in on the 20-day and 50-day exponential moving averages (EMAs). Why these? Because they're some of the most-watched levels by big-money institutional traders.
When a stock in a solid uptrend drifts back to one of these EMAs, it often finds a wall of buyers ready to defend the trend. The beauty here is its simplicity. You’re not just guessing where support might be; the moving average on your chart gives you a clear zone to watch for a potential bounce. This takes a ton of the guesswork out of the equation.
Plus, your risk-to-reward ratio gets a serious upgrade. When you enter on a dip instead of a soaring breakout, your stop-loss can be tucked in much tighter, meaning you risk less for potentially the same or even greater reward.
Crafting a Rule-Based Entry Plan
Just seeing a stock touch a line on a chart isn't enough to pull the trigger. A successful pullback trade requires a disciplined plan to confirm the trend is ready to resume. A sloppy entry can be the difference between catching the next leg up and getting caught in a painful trend reversal.
Here’s the simple checklist I run through to find and time these trades:
- Confirm a Strong Uptrend: First things first, the stock must already be in a healthy uptrend. That means it’s making a clear pattern of higher highs and higher lows and trading comfortably above its key moving averages (like the 50-day and 200-day).
- Wait for a Quiet Pullback: Patience is your best friend here. You have to let the stock drift down to a key moving average, like the 20-EMA or 50-EMA. The key is to see this pullback happen on lower-than-average volume—it tells you the selling pressure is light and not aggressive.
- Look for Buyer Confirmation: This is the most important part. Don’t buy just because the price touched the EMA. You need to see a bullish confirmation candle showing that buyers are stepping back in. This could be a hammer, a bullish engulfing pattern, or just a powerful green candle that closes near its high.
The goal is not to catch a falling knife. It's to see the knife hit the floor, stop, and then gently pick it up as it starts to bounce. The confirmation candle is your signal that the bounce has begun.
Managing Your Trade and Taking Profits
Once you get that confirmation candle and enter the trade, your risk management rules immediately kick in. Your stop-loss should go just below the low of that confirmation candle or a little bit below the moving average itself. This defines your exact risk before you even think about the potential profits.
As for taking profits, a straightforward and effective target is the previous swing high. If the stock can rally back to that level, it’s a great sign the uptrend has resumed. And just like with our other strategies, a potential reward that's at least twice your initial risk is a non-negotiable rule.
Let's walk through a quick example. Imagine you've spotted stock ABC on OpenSwingTrading; it's a market leader in a powerful uptrend.
- The Setup: The stock has gently pulled back to its 50-day EMA on light volume.
- The Confirmation: After a day or two of hovering around the 50-day EMA, a big bullish engulfing candle prints, closing strong. This is your signal. You enter near the close at $150.
- The Risk Management: The low of that bullish candle was 147**. You place your stop-loss just below it at **146.90, risking $3.10 per share.
- The Profit Target: The last major swing high was at 158**. You set your sell order at **157.50, aiming for a $7.50 per share profit. That's a reward-to-risk ratio of more than 2-to-1.
A few days later, the stock bounces hard off the moving average, hits your target, and you're out with a clean, well-managed profit. This is one of those timeless swing trading strategies for beginners that just plain works.
Trading the Moving Average Crossover
If you’re looking for a strategy that cuts through the noise and gives you clear-cut signals, the moving average crossover is a fantastic starting point. This is one of the most reliable swing trading setups for beginners in 2026 because it’s so beautifully simple. It's based on a single visual cue: a faster-moving average crossing over a slower one.
Think of that crossover as a green light. It signals a potential shift in market sentiment from bearish or sideways to bullish. By plotting a short-term average (like a 10 or 20-day EMA) against a longer-term one (like the 50-day EMA), you can instantly see when short-term strength is starting to pull the longer-term trend higher.
The biggest win here is clarity. You’re not trying to interpret fuzzy chart patterns or guess what the market is thinking. The chart gives you a direct, objective signal to act on, which is perfect for building the discipline every successful trader needs.
What the Crossover Tells You
The classic bullish signal is the "golden cross," where a short-term moving average pushes up through a long-term one. For swing trading, the 10/50-day or 20/50-day EMA combinations are incredibly popular. When that shorter average takes the lead, it tells you that recent prices are accelerating faster than historical ones—a strong hint that a new uptrend is getting started.
The flip side is the "death cross." When the short-term average drops below the long-term one, it's your signal that momentum is fading and it's probably time to get out. These black-and-white signals are powerful because they help you stick to your plan instead of making emotional, in-the-moment decisions.
The real strength of this strategy is its ability to capture the heart of a sustained trend. You might not get in at the absolute bottom, but the crossover gives you solid confirmation that a genuine shift in momentum is happening, providing the confidence to stay in the trade.
Of course, it's not a silver bullet. The moving average crossover is a lagging indicator, meaning it only confirms a move after it has already started. This can be a problem in choppy, sideways markets, where you can get "whipsawed"—stuck in a frustrating loop of buy and sell signals that lead to a string of small losses.
How to Stack the Odds in Your Favor
So, how do you avoid getting chopped up in a market that's going nowhere? The answer is context. Instead of blindly trading every crossover you find, you need to be more selective. Focus only on the signals that appear in the strongest sectors of the market.
This is where a tool like OpenSwingTrading becomes your secret weapon. Their daily sector strength analysis provides actionable insights that show you exactly where the big money is flowing, allowing you to fine-tune your approach.
Your daily workflow suddenly becomes much smarter:
- Step 1: Find the Strongest Sectors. First, pop over to OpenSwingTrading and see which sectors are showing the most relative strength.
- Step 2: Hunt for Crossovers. Now, you can run your scans but limit them to stocks within those top-performing sectors.
This simple two-step filter helps you ignore the noise from weak stocks and focus your attention and capital where the real trends are happening.
Putting It All Together: A Real-World Example
Let's walk through a setup.
Imagine you see that the technology sector has been leading the market for the past few weeks. You scan for stocks in that sector and find that QRS just had its 20-day EMA cross above its 50-day EMA on a big surge in volume.
To add another layer of confirmation, you could check an indicator like the Moving Average Convergence Divergence (MACD). If its MACD line has also just crossed above its signal line, you have multiple signs of bullish momentum lining up. You can learn more about how different indicators work together at platforms like HighStrike.com.
Here’s how you’d manage the trade:
- Entry: Buy the stock near the close of the day the crossover occurs.
- Stop-Loss: Place your initial stop-loss just below the 50-day EMA. This level will now act as a dynamic support line that trails your position higher.
- Exit: Stay in the trade until the 20-day EMA crosses back below the 50-day EMA. This is your objective signal that the trend is losing steam.
This complete, rules-based plan gives you a clear entry, a defined risk, and a logical exit—everything you need for a solid foundational strategy.
Your Daily 15-Minute Trading Routine
Knowing a few solid swing trading strategies is a great start, but the real secret to consistency is how you apply them day in and day out. It's not about being chained to your desk for hours; it’s about building a sharp, repeatable process that you can execute with discipline.
A good routine takes the emotion and chaos out of trading, turning it into a calm, proactive habit.
The best part? This doesn't have to take all night. In 2026, with the right tools, you can get a full read on the market, find the best stocks, and build your watchlist in about 15 minutes after the closing bell. That small daily commitment can have a massive impact on your bottom line.
First, Take the Market's Temperature
Before you even glance at a single stock chart, you need to know what the overall market is doing. Are we in a healthy uptrend that will lift most boats, or are conditions getting choppy? It's always easier to swim with the current than against it.
This is where we look at market breadth. In simple terms, this tells us how many stocks are actually participating in a market move. A healthy rally has broad participation, with tons of stocks moving up together. But if the major indexes are inching higher while the majority of individual stocks are falling, that’s a huge warning sign.
This is the first five minutes of your routine. The OpenSwingTrading dashboard is built for this, giving you a quick, data-driven snapshot of market health. It offers the actionable insights you need to immediately see whether it's a "risk-on" environment (time to be aggressive) or "risk-off" (time to protect capital).
Next, Follow the Institutional Footprints
Once you know the market is on solid footing, the next question is simple: where is the big money going? The institutions—hedge funds, mutual funds, the players who really move prices—don't just sprinkle their money everywhere. They make concentrated bets in the strongest sectors of the economy.
Your job as a swing trader is to find those leading sectors and fish in that pond. Trading a strong stock in a strong sector puts a powerful tailwind at your back, dramatically boosting your odds of success.
This is the second part of your 15-minute routine. Using a tool like OpenSwingTrading, you can see which sectors are showing the most relative strength. It's an objective, data-backed way to see where the real momentum is. This lets you ignore the noise and focus only on the market’s hottest areas, which should take you another five minutes.
A great setup in a weak sector can easily fail. A good setup in a leading sector has a much higher probability of working. "Follow the money" isn't just a catchy phrase; it's a core principle for profitable swing trading.
Finally, Pinpoint the Elite Candidates
With market health confirmed and the top sectors identified, you can now drill down to find the best stocks within those groups. This is the hunt for the A+ setups—stocks showing superior strength and forming one of the patterns we've discussed, like a clean breakout or a pullback to a key moving average.
This flow is exactly what you'd look for in a moving average crossover trade, starting with the big picture and narrowing down to the buy signal.
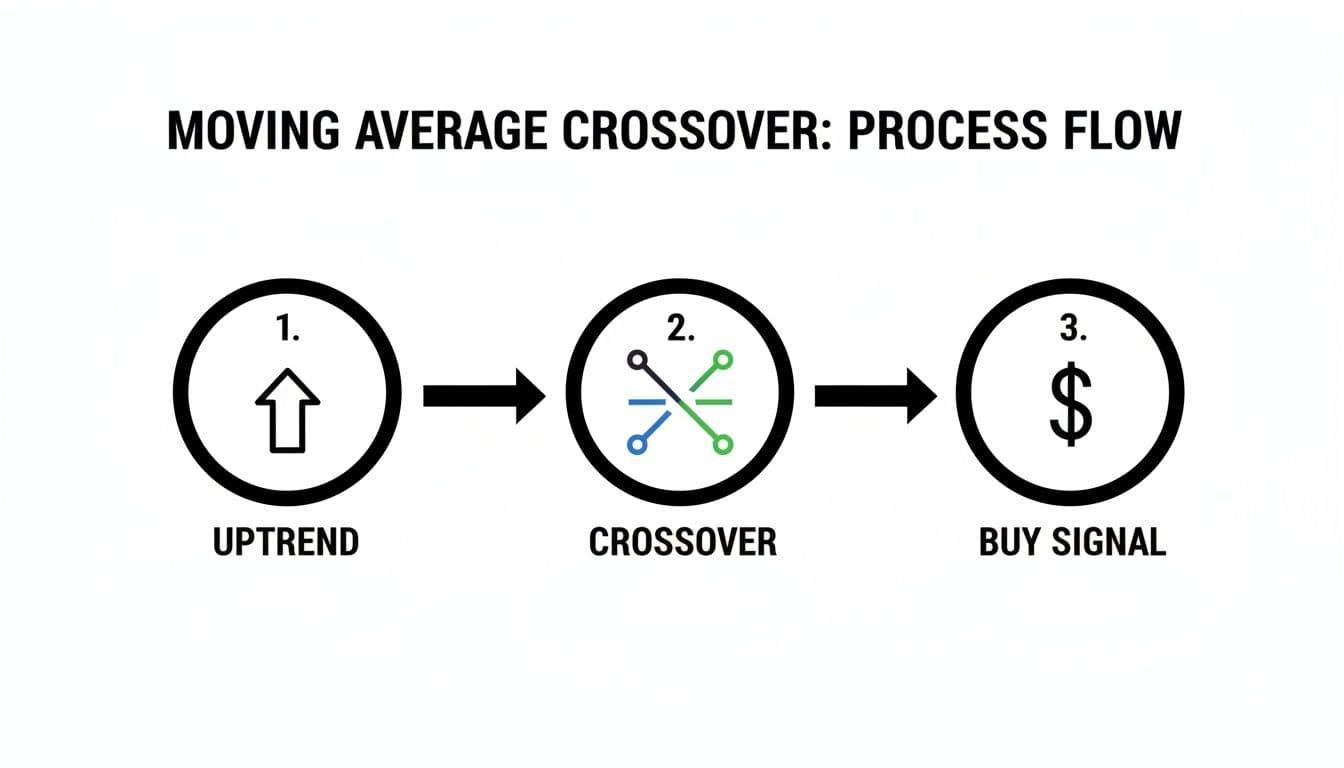
The graphic shows that a valid buy signal only appears after you've confirmed an established uptrend and the crossover itself, which helps filter out weaker, choppier setups.
In the final five minutes of your routine, you can run your scans for these prime candidates. Because you’ve already narrowed your focus to the strongest market areas, your list will be short, focused, and full of high-quality names. From there, you just add them to your watchlist for the next trading day, with your entry, stop-loss, and target levels already mapped out.
And that’s it. In 15 minutes, you’ve gone from a bird's-eye market view to a focused watchlist of actionable trade ideas, all without the stress and guesswork.
Common Questions from New Swing Traders
Jumping into swing trading is exciting, but let's be honest—it can also feel a little overwhelming. It's completely normal to have a ton of questions. Getting straight answers to these common concerns is the first real step toward building the confidence you need to actually place trades in 2026.
What Is the Best Swing Trading Strategy for a Complete Beginner?
When you're just starting out, the best strategies are the ones that are simple and don't leave a lot of room for guesswork. This is why I almost always point new traders toward either the Moving Average Pullback or the Moving Average Crossover strategy.
The pullback strategy is fantastic because it teaches you two of the most important skills right away: patience and risk management. It forces you to wait for a solid entry on a strong stock instead of just chasing whatever is moving that day. On the flip side, the crossover strategy gives you crystal-clear, objective signals for when to buy and sell. This is huge for taking emotion out of the equation and just building good habits. You really can't go wrong with either one.
How Much Capital Do I Really Need to Start Swing Trading?
This is probably the most practical question I get, and it's a crucial one. While you can technically start with just a few hundred bucks, a more realistic starting point for swing trading is somewhere between 5,000** and **10,000.
Why that range? A few key reasons:
- Meaningful Position Sizing: It lets you put on a trade that's big enough to actually make a difference if it works out, without betting the farm.
- Diversification: You'll have enough capital to hold a few different positions at once, which helps spread out your risk so one bad trade doesn't sink you.
- Psychological Buffer: Having enough cash in your account keeps you from feeling like you have to win on every single trade. It gives you the breathing room to take small, manageable losses, which is just part of learning the game.
The goal isn't just to make a few trades; it's to stay in the game long enough to get good at it. Starting with enough capital is what gives you that staying power.
Keep in mind, if you're in the US with an account under $25,000, you'll run into the Pattern Day Trader (PDT) rule. This rule limits you to three day trades in a five-day window. The good news is that since swing traders hold positions overnight, the PDT rule isn't much of a roadblock, making this style a great fit for new traders.
How Do I Find High-Potential Stocks for Swing Trading Each Day?
Finding the right stocks is where having a repeatable process separates the pros from the amateurs. Trying to manually look through thousands of charts every day is a recipe for burnout and frustration. You need a systematic, data-driven way to filter the noise and find the real opportunities.
This is where a daily routine using a platform like OpenSwingTrading is a game-changer. It delivers actionable insights by allowing you to see which sectors have the most momentum and then scan for the stocks within those sectors showing the best relative strength. This instantly points you toward the institutional favorites—the exact stocks that are most likely to lead the market higher. It turns stock selection from a guessing game into a logical, repeatable workflow.
What Is the Most Important Risk Management Rule for Swing Traders?
If you only take one piece of advice from this entire guide, let it be this: Never risk more than 1-2% of your trading capital on a single trade. This isn't just a friendly tip; it's the foundation of a long-term trading career.
Let's put that into perspective. If you have a 10,000** account, a **1%** risk means you've set your stop-loss so that you cannot lose more than **100 on that trade. This small, controlled risk lets you survive a string of losses—and trust me, every single trader has them—and still have plenty of capital to fight another day. It’s the single biggest difference between traders who blow up their accounts and those who are still around years later.
This one rule forces you to do the math and calculate your position size before you enter a trade. You'll know exactly what's at stake before you ever click the "buy" button. Master this, and you've already overcome the biggest hurdle most new traders face.
Ready to stop guessing and start using a data-driven process to find your next winning trade? OpenSwingTrading provides the market context and high-potential stock ideas you need to trade with confidence. Start your free 7-day trial today and see the difference.