Why your breakout stock watchlist misses leaders early
A practical troubleshooter for why your breakout stock watchlist keeps spotting winners late—diagnose late-add patterns, isolate root-cause biases, run fast triage tests, and rebuild inputs/process with RS-first selection, early-entry triggers, and clear kill rules.
If your watchlist only lights up after a stock has already doubled, you’re not “missing breakouts”—your system is selecting them late. The giveaway is a pile of charts that look close to perfect, then either fail or launch without you.
This troubleshooter helps you pinpoint where the leak starts: your universe, your screens, your timeframe mix, and your definition of “leader.” You’ll run a few quick tests, then rebuild the inputs and the day-to-day workflow so leaders show up earlier—and stay on your list for the right reasons.
What’s Breaking
Your watchlist isn’t failing because you “missed the news.” It’s failing because your process rewards proof after the move, not clues before it. The result looks like “I added it yesterday” and trades that start already tired.
Late Add Patterns
You’re adding candidates after the market has already voted, because it feels safer.
- Add after a 10% green day
- Add after headline-driven volume spikes
- Add only after the breakout print
- Add once it trends on social feeds
- Add when alerts finally trigger
That’s not early leadership spotting. That’s chasing confirmation.
False “Almost” Setups
Your list can look busy and still be low quality, because “close enough” setups seduce.
- Form repeated upper-wick reversals
- Break out intraday, fail by close
- Print heavy volume on down days
- Stall at pivot, then drift lower
- Reclaim levels, then lose them fast
If “almost” is common, your criteria is selecting indecision, not demand.
Performance Snapshot
Measure it like a system problem, not a feeling. Track three numbers: percent of true leaders you owned before the breakout day, average percent above the pivot when you entered, and win rate for those entries. If you need a phrase, use “How often am I early, and how expensive is my early?”
When those metrics are ugly, your watchlist isn’t a list. It’s a lagging indicator.
Root Causes
Your watchlist isn’t “missing” leaders by accident. Your rules are filtering them out before they look safe.
These are structural failures, not willpower problems. Fix the system first.
Universe Too Narrow
You’re scanning what you already know, so you only find what’s already established. That feels efficient, until the next leader comes from the place you never look.
Most watchlists get quietly constrained by habit.
Familiar sectors only: you miss new theme rotations. Large caps only: you miss the early liquidity ramp. One screener template: you miss different leader “shapes.” “Quality” filters too early: you exclude messy hypergrowth.
If your universe can’t produce surprises, it won’t produce leaders.
Static Screening
Fixed thresholds make you late because breakouts are a process, not an event. Early leaders often signal through change, not absolute numbers.
Static filters miss the transition.
Volume: accumulation shows up as a pattern, not one spike. Volatility: contraction precedes expansion, then the headline breakout. Relative strength: inflections happen before RS “looks good.” Trend filters: early bases violate clean moving-average rules.
Screen for shifts, not checkpoints, and you’ll see leaders earlier.
News-Chasing Bias
Headlines feel like confirmation, but they’re usually timing poison. By the time a story is obvious, the easy entry is gone.
Bad Timeframe Mix
One timeframe gives you a one-eyed view. Leaders build on higher timeframes, then trigger on lower ones.
No “Leader” Definition
If “leader” just means “up a lot,” your list will always be reactive. You need a profile you can recognize while it’s still forming.
Define a leader before you screen.
RS trend: rising versus the index, not flat then vertical. Liquidity: enough volume for institutions to size. Institutional footprint: tight closes, support at key levels. Clean structure: orderly base, not random whipsaws.
When your definition is precise, your watchlist stops guessing. For a clear way to define and track that RS line, see this price relative / relative strength reference.
Quick Triage Tests
When your watchlist misses leaders early, the cause is usually mechanical. These quick tests show whether your rules are late, too strict, or tuned for the wrong market.
Leader Backtest
Run a small retro test to see how early your rules could have found real winners.
- Pick 10 past leaders from your market and timeframe.
- Mark the first date each showed an “early” signal you trust.
- Mark the first date each met your current watchlist criteria.
- Record the gap in days and % move.
- Note the rule that delayed inclusion. A consistent gap means your process is designed to arrive after the move starts.
Screener Sensitivity
Change one threshold at a time to learn what your screener is really filtering out.
- Lower volume and rerun; count new names.
- Raise volume and rerun; see which leaders disappear.
- Repeat for price, market cap, RS rank, and ADR.
- Save each result as a separate list.
- Inspect overlap between lists and your missed leaders. If one knob flips the list, your “edge” is mostly a parameter choice.
Chart Audit
Your watchlist is a record of your triggers, not your intentions. Pull 20 recent adds and tag what caused the add: “breakout,” “pullback,” “news,” “earnings,” or “RS surge.” Then count the tags and scan for a pattern, like most adds happening only after a breakout day. If your triggers skew late, your watchlist will always feel late.
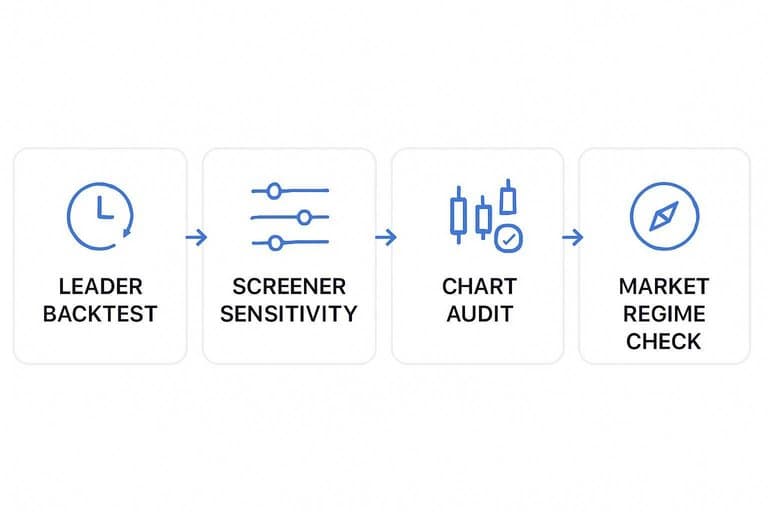
Market Regime Check
Match your rules to what the tape is paying for right now.
| Regime | What leads | What breaks screens | Rule tweak |
|---|---|---|---|
| Trending | Breakouts, adds | Tight volume filters | Loosen volume |
| Choppy | Mean reversion | New-high rules | Prefer pullbacks |
| Risk-off | Defensives, cash | High beta, small caps | Raise quality |
| Rotation | Sector leaders | Broad RS rank | Add sector RS |
| A great screen in the wrong regime is still the wrong tool. |
Fix the Inputs
Your watchlist fails early because your inputs are optimized for “obvious breakouts.” That’s late-stage data. Change the universe, rank by relative strength first, then scan for tightness and sponsorship.
Expand the Universe
Broaden your search without letting junk swamp the results.
- Add small and mid caps above your minimum dollar volume.
- Include IPOs after 3–6 months of trading history.
- Add one-hop sector adjacencies, like semis plus equipment makers.
- Build theme baskets, like “AI infrastructure,” then scan inside.
- Cap results per industry group to avoid one-sector takeover.
Do this and you’ll see leaders while they still look “too early.”
Use RS First
Price breakouts are outcomes. Relative strength trends are the cause.
- Rank by RS line uptrend over 3–6 months.
- Require RS new highs within the last 20 sessions.
- Filter for minimum liquidity, like $20M+ daily dollar volume.
- Keep price above a rising 50-day, or above a flat 200-day.
- Only then check for base structure and breakout levels.
When RS leads, you stop chasing and start stalking.
Volatility Contraction
You’re looking for compression before expansion. Tight stocks move first.
- Shrinking daily ranges over 2–4 weeks
- Volume drying up on down days
- Higher lows tightening into resistance
- Compressed ATR or ADR versus 3-month average
- Multiple tight closes near highs
If volatility isn’t contracting, the “setup” is just noise.
Institutional Clues
Funds leave footprints. Your job is to spot the clean ones.
- Supporting volume on up weeks
- Tight weekly closes near highs
- Limited drawdowns after strong runs
- Orderly pullbacks, not air pockets
- Quick reclaim after undercuts
That’s the line between sponsored leaders and random rallies.
Early Entry Triggers
Early entries are where risk is small and information is fresh. Think “actionable before the crowd,” like a trendline break on rising volume, the first pullback to the 10/20/50-day after a thrust, a pocket pivot through a short-term reference, or a reclaim of a prior level after an undercut.
Write the trigger, the invalidation, and the add point before you buy. That’s how you turn a chart into a plan.
Fix the Process
Your watchlist fails when it only reacts to what’s already obvious. The fix is a routine that keeps feeding you candidates before they hit “everyone’s talking about it.”
Two-Tier Watchlist
Build two tiers so you always know what to study versus what to trade, and why. Think “Emerging” as your farm system, and “Actionable” as your game-day bench.
Keep it simple:
- Emerging (max 30): early leaders, messy charts, strong RS.
- Actionable (max 15): clean bases, clear levels, liquid.
- Promote when: new RS high + constructive base + defined trigger.
- Demote when: loses RS trend or breaks key structure.
Your edge is the promotion rule, not the ticker count.
Daily Pipeline
You need a repeatable daily flow that prevents “chart hypnosis.” Timeboxes force decisions and keep you from overfitting one perfect setup.
- Scan (10 minutes): run the same RS and liquidity filters.
- Shortlist (5 minutes): keep only names with fresh strength.
- Chart review (20 minutes): grade trend, base, and tightness.
- Levels (10 minutes): mark pivot, support, and invalidation.
- Alerts (5 minutes): set triggers, then close the chart.
If it doesn’t earn an alert fast, it doesn’t deserve your attention.
Weekly Deep Work
Daily scans find candidates, but weekly work builds conviction and context. This is where you spot rotation early and map bases before they’re obvious.
- Review sector rotation (15 minutes): identify strengthening groups.
- Pull RS leaders by industry (20 minutes): rank within each group.
- Map weekly bases (30 minutes): draw ranges and key inflection points.
- Update thesis notes (15 minutes): catalyst, risk, and “why now.”
When the breakout comes, you won’t be meeting the stock for the first time.
Alert Architecture
Alerts are your early-warning system, not a notification addiction. Set them where a leader “proves it,” not where you merely feel interested.
- New RS highs versus benchmark
- Reclaim of key moving averages
- Tight range break from consolidation
- Volume thrust above recent average
If your alerts are quiet, your process is working in the background. If you want a proven early-entry volume trigger, the classic pocket pivot concept is a useful complement to basic breakout alerts.

Kill Rules
Watchlists rot when nothing ever dies. Objective kill rules keep your attention on strength, not on hope.
- Breaks RS trend for two weeks
- Shows heavy distribution on volume
- Fails base and undercuts support
- Loses liquidity and spreads widen
Cut fast so your next leader has somewhere to land.
Common Misdiagnoses
Most late entries come from the wrong story, not the wrong scan. You fix the scan, but you keep blaming the same “obvious” culprits.
Misdiagnosis vs what’s actually happening
You need a faster way to separate a real leader from a noisy mover.
| You blame | What’s actually happening | What to watch instead | Your next move |
|---|---|---|---|
| “No volume yet.” | Accumulation is quiet early. | Up days on higher volume | Track relative volume trend |
| “It’s too extended.” | You missed the first base. | Tight flags above MAs | Buy the first tight pullback |
| “News-driven pump.” | Catalyst exposed existing demand. | RS rising before news | Check pre-news RS line |
| “My screen didn’t catch it.” | Your filters exclude leaders early. | RS + liquidity + compression | Loosen growth filters temporarily |
| “It’s a meme.” | You’re seeing crowd attention, late. | Institutions supporting pullbacks | Compare pullback volume slope |
Stop diagnosing the symptom. Diagnose the phase, then set alerts for the next phase change.
Rebuild Your Watchlist to Surface Leaders Early
- Run the triage: backtest recent leaders, stress-test screener sensitivity, audit charts for recurring “almost” patterns, and confirm the current market regime.
- Fix the inputs: expand your universe, rank by relative strength first, then layer volatility contraction, institutional clues, and objective early-entry triggers.
- Fix the process: maintain a two-tier watchlist, push candidates through a daily pipeline, schedule weekly deep work, build alerts that match your triggers, and apply kill rules fast.
- Recheck monthly: if your list still fills with late-stage names, tighten the leader definition and adjust the timeframe mix until the watchlist consistently flags emerging strength before the crowd.
Frequently Asked Questions
How many stocks should I keep on a breakout stock watchlist to catch leaders early without losing focus?
Most traders do best with 25–75 names, split into 3–5 themed sublists (leaders, emerging, earnings setups) so you can review in 15–30 minutes per day. If your list regularly exceeds 150, you’ll usually react late because you can’t monitor context and price/volume action consistently.
How do I measure whether my breakout stock watchlist is actually finding leaders early?
Track “days early” (first watchlist add date vs. first major breakout date) and the hit rate (names that later make a 20–30% move within 4–12 weeks). A simple spreadsheet plus alerts in TradingView, Thinkorswim, or TrendSpider is enough to score this weekly.
Do I need fundamental data on a breakout stock watchlist, or is price/volume enough?
Price/volume can work, but adding a few fundamentals (revenue growth, EPS acceleration, margins, guidance) usually improves early-leader detection by filtering out low-quality spikes. Most watchlists perform better when fundamentals are used as lightweight confirmation rather than heavy gating.
Can I use relative strength (RS) rankings instead of a breakout stock watchlist?
RS rankings are great for finding strong names, but they often surface leaders after they’ve already moved and become widely recognized. A breakout stock watchlist complements RS by tracking early basing, tight ranges, and constructive pullbacks before the top of the move.
How often should I update and review a breakout stock watchlist in 2026 markets?
Update daily after the close (or pre-market) and do a deeper refresh weekly to rotate in new themes and remove broken setups. Most people get earlier entries by pairing daily alerts with a 60–90 minute weekend review of the full universe.
Spot Leaders Before They Run
If your breakout watchlist keeps surfacing names after the move, the fix is better inputs and a tighter daily selection workflow.
Open Swing Trading brings daily RS rankings, breadth, and sector/theme rotation into one research view so you can shortlist emerging leaders faster—get 7-day free access with no credit card.