Why Your William O'Neil Breakouts Fail in Chop
A practical troubleshooting guide to why William O’Neil-style breakouts fail in choppy markets—spot regime cues, reinterpret volume in ranges, validate real bases and pivots, adjust stops and sizing, and confirm index/sector tailwinds before you press entries.
You do everything “right”: clean base, big volume pop, textbook pivot—and the breakout still reverses into your stop. If that keeps happening, it’s usually not your stock-picking; it’s the market environment and a few subtle execution errors that chop punishes.
This troubleshooter helps you diagnose what’s actually breaking: regime mismatch, misleading volume in ranges, bases that are too loose, pivots drawn in the wrong place, stops that can’t survive noise, and missing market tailwinds—so you can either adapt or stand down with confidence.
Chop vs Breakout Logic
Chop is a market that goes sideways while pretending it’s moving. You get motion, but not progress.
In chop, price spends more time reversing than trending. The classic O’Neil breakout relies on smooth accumulation, then expansion, like “tight base, big lift.”
Chop identification cues
Chop shows up on the chart before it shows up in your P&L. You’re looking for repeated cancellation of progress.
- Overlapping bars with little net advance
- Frequent gap fills within one to three sessions
- Follow-through days failing within three to five sessions
If you see two or more, treat breakouts as suspect until proven trending.
Breakout premise mismatch
O’Neil breakouts assume institutions press highs and hold gains as new buyers arrive. In chop, institutions do the opposite.
They fade strength into prior highs and defend lows at obvious support. Price becomes a ping-pong match, so your breakout turns into someone else’s liquidity.
A quick market regime check
Label the regime before you scan for breakouts. It keeps you from applying trend tools to range behavior.
- Check major index above or below the 21/50-day averages.
- Note whether the last five days made net progress or churned.
- Count gap outcomes: held open direction or filled quickly.
- Review the last follow-through attempt and its day-3 to day-5 result.
- Classify: trend, range, or transition, then match your playbook.
Do this first, and your “setup quality” improves without changing a single chart filter.
Volume Lies in Ranges
In a trading range, “heavy volume” often looks like confirmation. It’s frequently just rotation, hedging, and two-sided business printing a big number without real direction.
You get the classic O’Neil trigger, you feel validated, and then price goes nowhere. That’s the trap.
Two-sided volume signatures
Churn is what heavy volume looks like when nobody is actually in control. It shows up when large players trade against each other, not when institutions press a trend.
Big volume. Small daily spread. Close near the middle. Then it stalls again near the prior high, like price is hitting a soft ceiling.
If you see that combo more than once, you’re watching distribution disguised as “demand.”
What to compare instead
Raw volume is noisy in chop, so compare it to behavior that implies one-sided urgency. Use rules you can check in seconds.
- Volume on up days versus down days
- VWAP reclaim and hold after the open
- Close location value versus the range
- Breakout bar spread versus prior bars
- Retest behavior at the pivot
If price can’t close well and hold well, the volume number is just decoration.
When volume is valid
You need a quick filter for “real buying” versus “busy tape.” Make it a decision tree, not a vibe.
- Confirm a wide spread bar that expands the range.
- Require a close in the top 20% of the day.
- Check the market is trending, not mean-reverting.
- Demand the next day holds above the pivot.
If it can’t hold the pivot the next day, the breakout was liquidity, not leadership.
Bases That Aren’t Bases
Some patterns look like a clean cup-with-handle, but they behave like distribution inside a range. You buy the “breakout,” and the stock acts heavy because supply never left.
Loose base red flags
A real base should get quieter as it matures. A “too-loose” base stays loud, and that noise is usually sellers.
- Print wide weekly ranges near the right side
- Show multiple undercut-and-rallies at prior lows
- Leave repeated heavy selling tails on down weeks
- Drift handles below key moving averages
Treat three or more as a range, not a launchpad.
Tightness you must see
You want the right side to look boring. Think “tight closes” and smaller bars, not drama.
Tightness shows up as several weekly closes clustering in a narrow band, with volatility compressing into the pivot. Pullbacks look constructive, too. They are short, shallow, and they respect obvious support like the 10-week line.
When the stock stops advertising liquidity, that’s usually because supply is drying up—exactly what the Volatility Contraction Pattern (VCP) is designed to highlight.
Handle placement checks
Validate the handle before you even think about the pivot.
- Check depth: keep it shallow, not a mini base collapse.
- Check duration: long enough to shake, not long enough to decay.
- Check location: in the upper base, near prior highs.
- Check volume: contract as price tightens.
If the handle fails one check, you’re probably buying chop with a nice label.

Pivot Placement Mistakes
In chop, a mis-drawn pivot doesn’t “trigger a breakout.” It drops you straight into overhead supply.
You buy the first pop, then meet sellers who’ve been waiting at the real level. That’s the line that gets crossed.
Common pivot errors
Most failed O’Neil-style breakouts in chop start with a pivot that wasn’t earned. Your entry becomes a gift to trapped holders.
- Using intraday highs as the pivot
- Ignoring weeks-ago resistance overhead
- Picking pivots inside the range
- Not adjusting after an undercut
If your pivot sits where sellers already proved themselves, reversals are the default outcome.
Better pivot alternatives
Your pivot should sit where supply is already thinned, not where it’s concentrated. Think “clean edge” or “post-shakeout reclaim,” not “random tick high.”
Use pivots like these:
- Range-edge pivots at obvious resistance, with space above.
- Post-shakeout highs after an undercut-and-rally, with tight closes.
- Buyable gap-up highs, only with volume and hold-the-open behavior.
The goal is simple: enter where the next sellers are farther away.
A redraw workflow
Redraw pivots top-down so your “breakout level” matches what institutions actually trade. Weekly first. Then daily. Then intraday.
- Mark weekly swing highs and multi-week closes, not wicks.
- Drop to daily and connect the range edges that repeat three times.
- Note any undercut-and-rally, then move resistance to the post-shakeout high.
- Use intraday only to refine execution, not to invent the pivot.
- Recheck: your entry should clear resistance with room to run.
If weekly disagrees with daily, weekly wins. Every time.
Stop Placement in Chop
A clean 7–8% stop works in trends because momentum keeps pushing. In chop, that same stop becomes a magnet, like placing cash under the doormat.
You get tagged, you’re out, and price snaps back into the range five minutes later.
Why stops get clipped
In ranges, price hunts the obvious levels because that’s where orders stack. The classic move is an undercut: it dips below a prior low, triggers stops, then reverses fast.
Think “liquidity sweep,” not “my breakout failed.” Mean reversion does the rest, pulling price back to the range midpoint after that quick pierce.
If your stop sits under the cleanest low on the chart, you’re offering liquidity.
Chop-safe stop options
You need stops that respect structure, or rules that limit exposure without donating to noise.
- Place a structural stop below the range low
- Use a time stop if progress stalls
- Scale out, then stop-and-reenter on reclaim
- Add an ATR-based buffer beyond the level
Your goal isn’t a tighter stop. It’s a stop that price must earn.
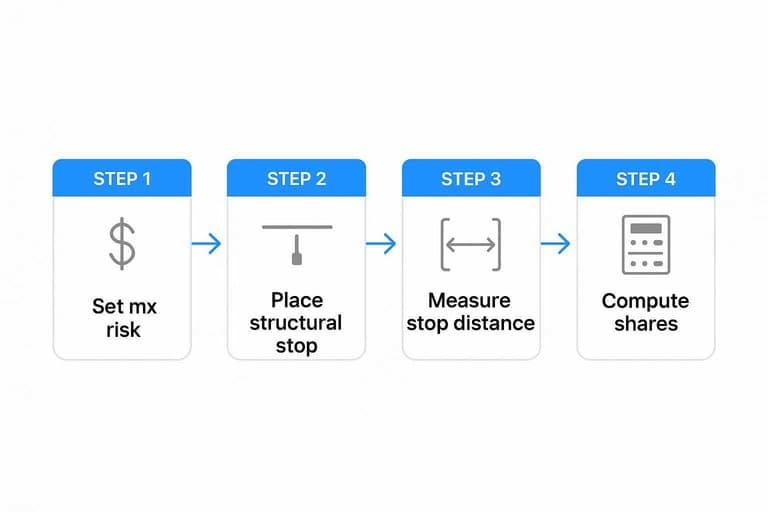
Position sizing fix
Wider stops only work if you shrink size first.
- Set your max risk per trade in dollars.
- Place a structure-based stop where the range is invalidated.
- Measure stop distance in dollars per share.
- Compute shares: risk dollars ÷ stop distance.
- Reduce shares until the math fits.
When chop forces wider stops, position size is the control knob, not your stop placement.
Market Tailwind Missing
William O’Neil-style breakouts need a market wind at their back. When indexes chop, leaders can’t get follow-through, and your “perfect” pivot becomes a coin flip.
You’ll see it in real time: the stock clears the buy point, then fades as the index rolls over at the 50-day. That’s not your entry. That’s the environment.
Index health checklist
You’re not trading one chart. You’re trading your stock plus the index tape.
- Index above 21/50 DMA, both rising
- Breadth thrusts: advancers lead for days
- Few distribution days in two weeks
- Volatility compressing, then expanding upward
If you can’t check most boxes, treat breakouts as rentals, not positions.
Sector correlation trap
Chop creates fast rotation, and rotation kills persistence. Your best-looking leader is usually the most crowded bet, so it fails first when money pivots.
One week it’s software, then it’s energy, then it’s “defense.” That shift breaks the clean O’Neil sequence: tight base, breakout, add, trend.
Stop worshipping the prettiest chart. In chop, correlation whipsaws you before the pattern can work.
When to stand down
You need a rule that turns you from hunter to builder. It keeps you from forcing A+ setups into a C- tape.
- Cut new breakout attempts after repeated failed follow-through.
- Shift to watchlist work: bases, relative strength, clean pivots.
- Wait for indexes to reclaim 21/50 DMA and hold.
- Demand a follow-through day before sizing up.
- Start with probes, then add only on strength.
Your edge isn’t courage. It’s timing your aggression to the tape.
Run the Chop Filter Before Your Next Breakout
- Check regime first: If the index is overlapping, whipsawing around key MAs, or failing to follow through, treat breakouts as guilty until proven innocent.
- Validate the base: Demand tight closes, controlled pullbacks, and a properly placed handle; skip loose, wide, or news-driven shapes.
- Redraw the pivot: Favor the cleanest resistance line with minimal overhead supply, and avoid “obvious” highs inside a sloppy range.
- Reframe volume: Compare thrust vs. prior up days and selling pressure vs. down days; don’t assume a single spike means accumulation.
- Adjust risk: Use chop-safe stops (structure-based, not arbitrary) and reduce size so a wider stop doesn’t inflate your dollar risk.
- Require a tailwind: If index and sector aren’t aligned, pass—your best edge in O’Neil breakouts is momentum, not prediction.
Frequently Asked Questions
Does the William O'Neil breakout strategy still work in 2026 markets?
Yes, but it works best in trending markets with broad institutional sponsorship and repeated follow-through. In choppy, range-bound conditions, the same breakout rules often produce more false starts and quick reversals.
How can I tell if the market is too choppy for William O'Neil breakouts before I buy?
Check whether major indexes are making higher highs with multiple distribution days staying limited, and whether recent breakouts are holding above pivots for 1–2 weeks. If leaders are failing within 1–3 days and the index is sideways, conditions usually aren’t supportive.
What should I do instead of a William O'Neil breakout when the market is in chop?
Most traders shift to capital preservation: smaller position sizes, fewer new buys, and waiting for a confirmed uptrend. If you must trade, focusing on quicker timeframes or mean-reversion setups often fits ranges better than breakout entries.
Are William O'Neil breakouts better on weekly charts than daily charts in choppy markets?
Often yes, because weekly charts filter out noise and can reduce whipsaws around pivots. You still need confirmation from the general market trend and relative strength, but weekly pivots can keep you from reacting to every intraday shakeout.
What results should I expect from William O'Neil-style breakouts in a sideways market?
Expect a lower win rate and smaller average gains, with more scratch trades and stopped-out attempts. A practical benchmark is that breakouts should hold above the pivot quickly and show progress within 3–5 trading days; if not, odds usually deteriorate.
Find Leaders in the Right Regime
When chop distorts volume, bases, pivots, and stops, the edge comes from aligning William O’Neil setups with real market tailwinds and leadership.
Open Swing Trading surfaces potential breakout leaders with daily RS rankings, breadth, and sector/theme rotation context—so you can filter chop fast and build a tighter watchlist in minutes.